Over the weekend Israel and the United States carried out a coordinated attack on Iran that killed Iran's Supreme Leader Ali Khamenei. Markets have already been fragile as of late and have been selling off on any excuse, and this new conflict in the Middle East may rattle the markets even more. Inflation has been a recent concern again with the last couple of inflation readings coming in hotter than expected. With the attacks over the weekend, oil prices are set to jump which will increase gas prices at the pump and further cause inflation fears. Last week the markets attempted a rally which failed into the end of the week. The Russel 2000 was the weakest and close down 1.2% for the week while the Nasdaq fell 1% and the S&P lost 0.4%.
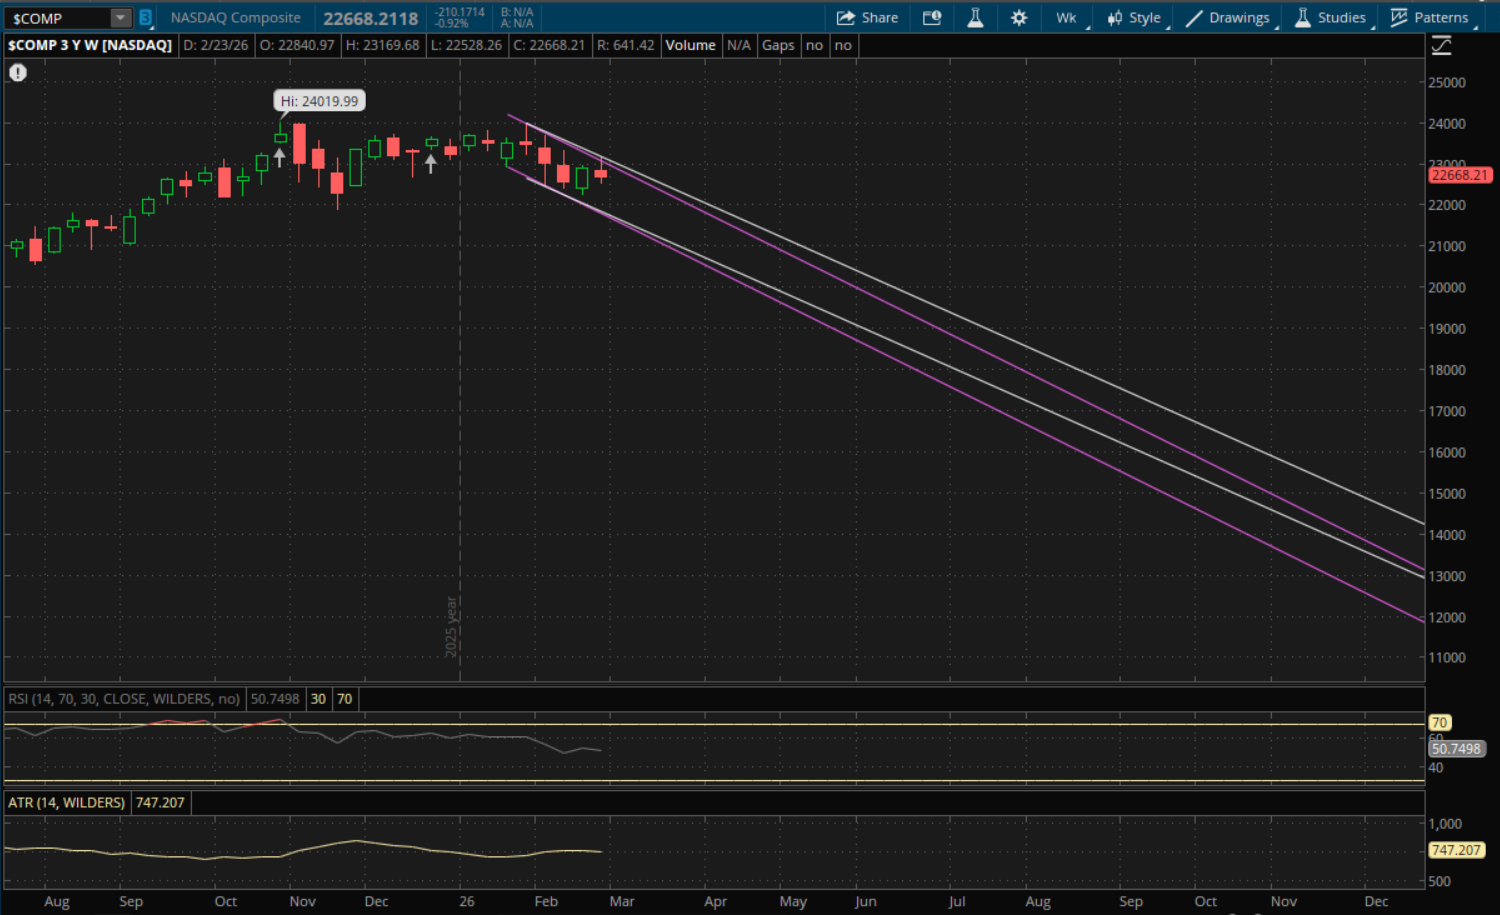
Looking at weekly levels for this week, the Nasdaq had a failed breakout above its prior weekly downtrend which now starts a new weekly downtrend for it. The first resistance level to watch on a bounce will be at about 22,850 which will be a retest of last week's failed breakout (purple). This would be an ideal spot to short if we get this bounce before any significant move lower to start the week. Its new downtrend (white) would be the next resistance level at about 22,960. Meanwhile, on a continued sell-off this week, the first key support will also be from its new downtrend (white) at about 21,650. If that does not hold, then its prior downtrend (purple) would be next at 21,550.
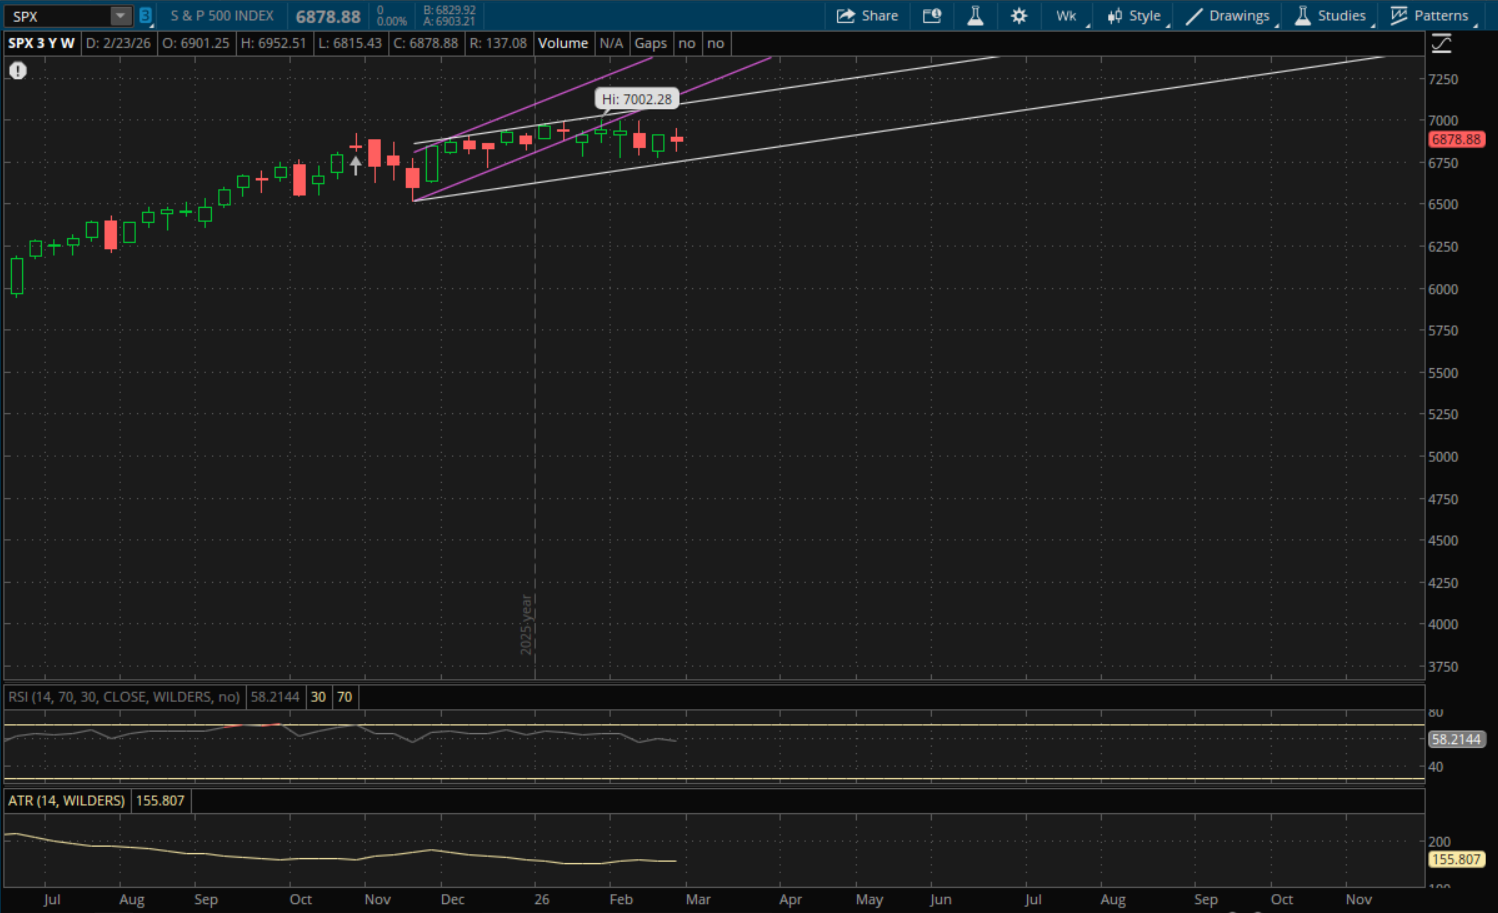
The S&P remains in its same weekly uptrend that it has been in since November of 2025. It has been extremely choppy and it has not broken through this uptrend either way over the past few months, so nothing changes for it again. Its current primary uptrend (white) will now be support at 6,770-6,775 this week. Resistance from this same trend would be at 7,110-7,115, however at this point I think it's much more likely that it breaks down through support.
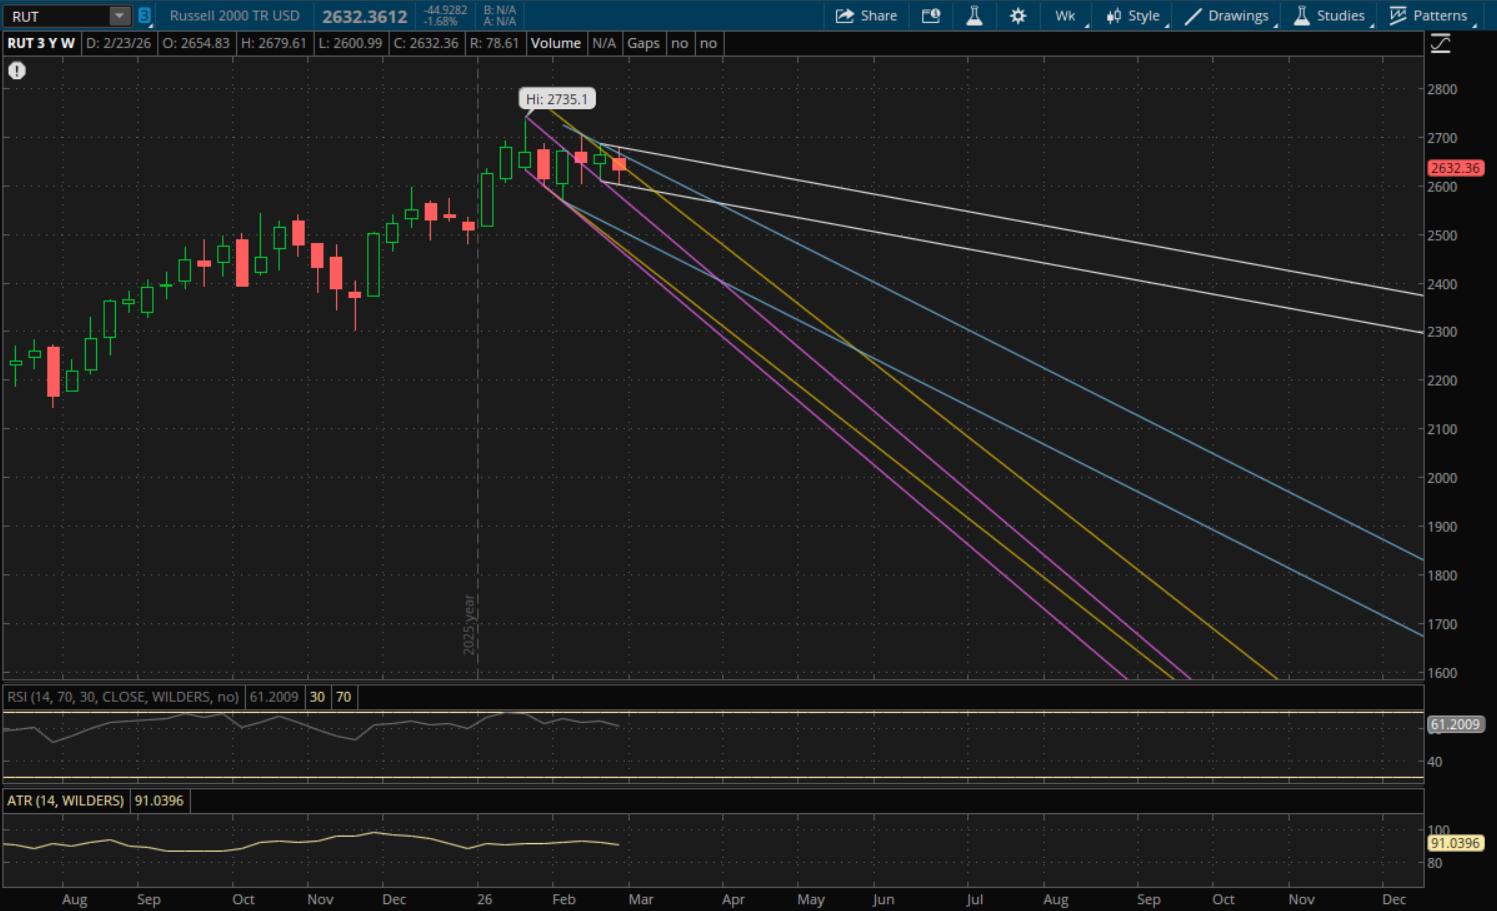
The Russell 2000 also had a failed breakout, similar to the Nasdaq, but in the Russell's case its prior trends are still valid so there are several weekly levels to look at. First let's look at resistances and the retest of last week's failed breakout would be the first key resistance to watch will be at about 2,647 on a bounce. If it breaks through this, then the next resistance will be from its new downtrend (white) that it started which will be at about 2,672.
Supports to watch on a pullback will be at 2,615 from its prior downtrend (yellow) and then its new primary downtrend (white) would be next at 2,593. If that does not hold, then its prior downtrend (purple) would be the next level to watch at about 2,544.