The markets had a pretty choppy session today and finished relatively unchanged with the Russell 2000 closing up 0.24% while the Nasdaq and S&P closed down by 0.31% and 0.28%, respectively. The VIX closed up 3.11% above $20 again as markets await some data tomorrow morning. The big data point we will get is PCE at 8:30 AM EST (personal consumption expenditures) which is the Fed's preferred inflation gauge. Recent CPI reports have come in cooler, and we'll see if the trend continues with tomorrow's PCE. We'll also get quarter over quarter GDP data at the same time followed by consumer sentiment data after the market opens at 10:00 AM EST.
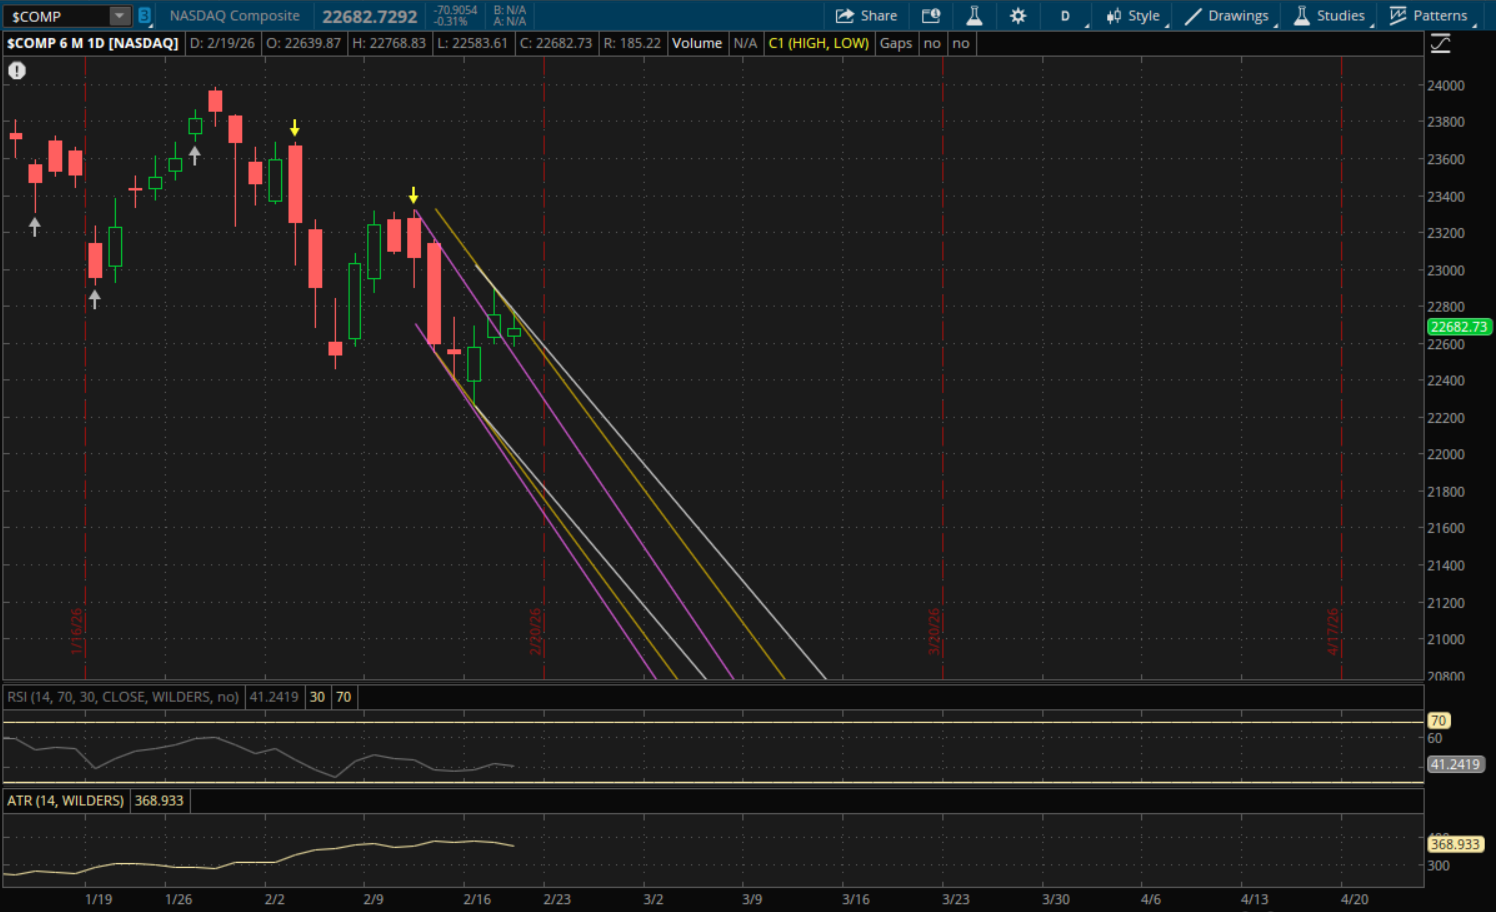
Today the Nasdaq did open below its primary downtrend resistance but it started to break through it in the morning. It did not close above it though, so now it is technically a failed breakout and starts a new downtrend. However, due to the angles of the current downtrends it is going to be harder and harder to stay in them. In fact, it will need to gap down tomorrow in order to open below them. I also started a long position in QQQ today as I believe the market has put in a short term bottom that started from the reversal two days ago which gave the Nasdaq (and S&P) bullish divergences on the daily. Yesterday's follow through day was constructive, and so was today's rally back into the close. There is always risk of a gap down or breakdown again, but I think given the recent correction of over 7% in the Nasdaq and how the technicals are setting up that the risk is now to the upside at least in the very near term.
The first level I'm watching tomorrow in the Nasdaq is going to be at about 22,640 from the new downtrend that was started today (white). Its prior downtrend that it failed to close above today (yellow) will be just below that right around 22,600. Since the Nasdaq closed at 22,682 today, it will have to gap down tomorrow morning to open back below these levels. While this is possible because they aren't far away, it is more likely that we see an open above (because it's currently above them) in which case they would be supports on a retest. Now if it does gap down below these levels then they will remain as resistance, and the next big support to watch would be at about 22,365 from its prior downtrend (purple). On a rally, we will need to see how it closes tomorrow to determine the next daily trend, but for now I would be looking at the 22,880 area which is intraday resistance and that level is almost 1% away from where it closed today.
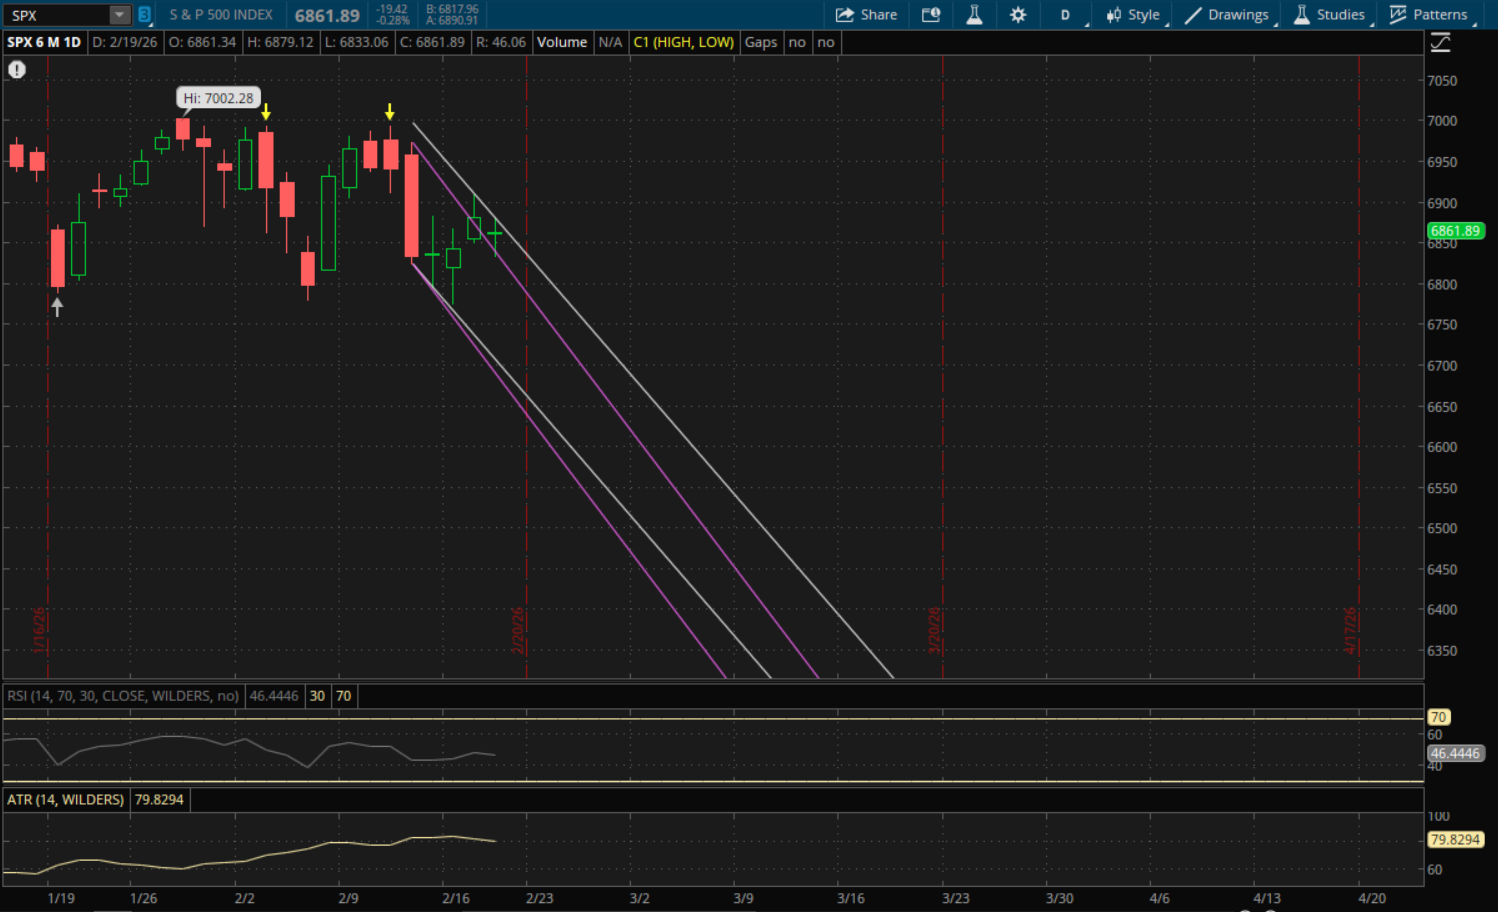
The S&P also opened below its primary downtrend this morning at about 6,880 which was the key level I mentioned in yesterday's update. It did make a rally attempt for it, but put in a high of 6,879.12 and did not break through it. So unlike the Nasdaq which did break through it, the S&P failed to do it and so now it does not start any new trends going into tomorrow. Its primary downtrend (white) will now be at about 6,850 for tomorrow and the S&P closed today at 6,861.89. So just like with the Nasdaq, the odds are in favor of an open above this downtrend in which case it would become support. It would need to gap down below 6,850 tomorrow for that level to remain as resistance. If that happens, then the next support will again be from its prior downtrend (purple) at about 6,805.
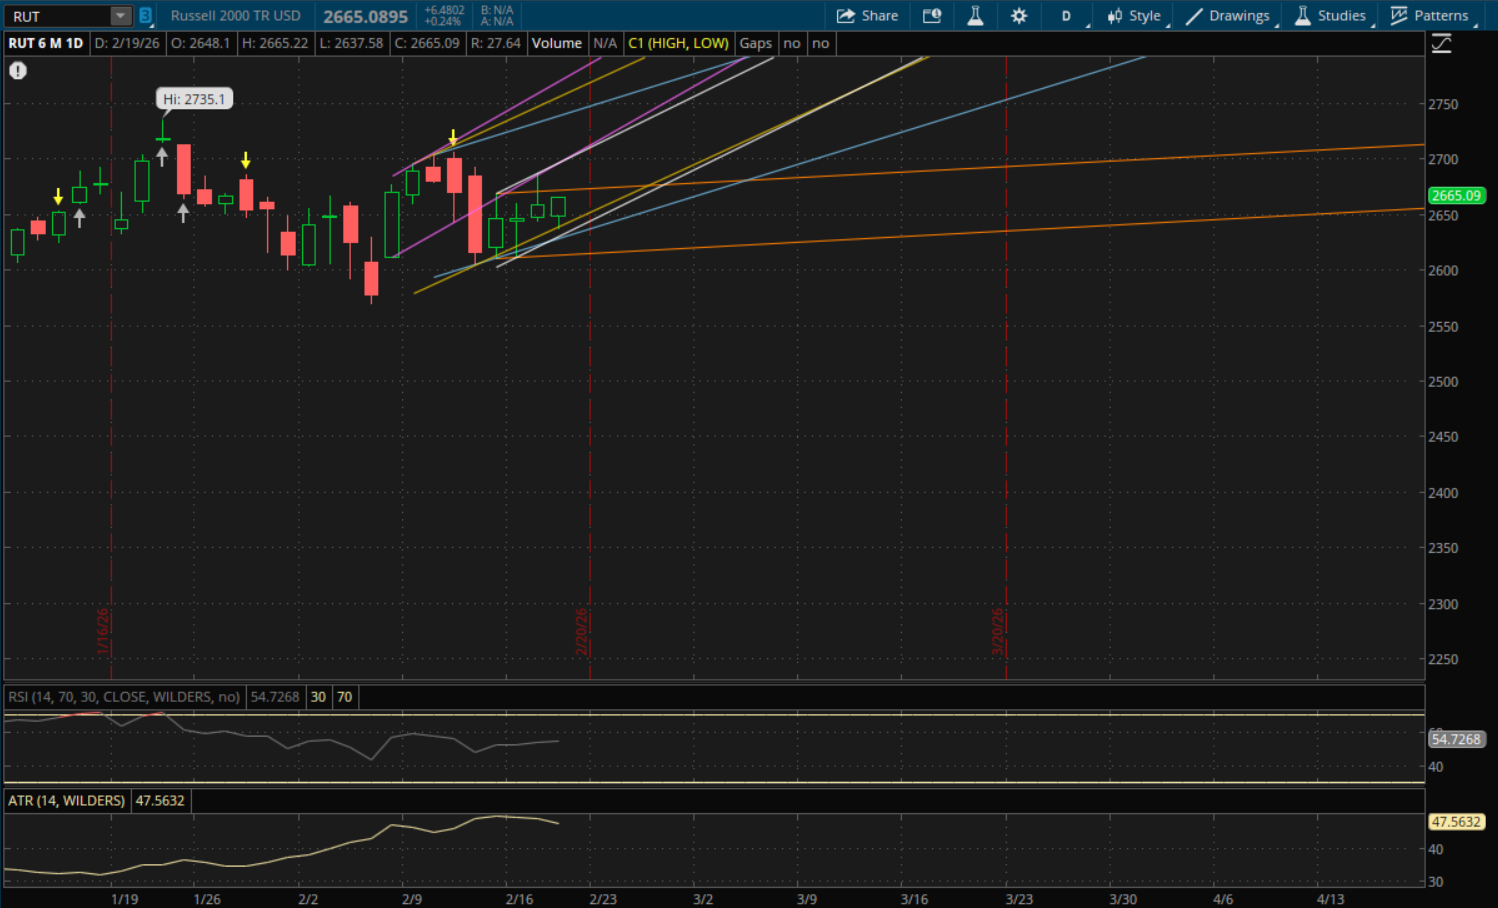
The Russell 2000, which led today, also gapped down and held its first support around 2,639 that I mentioned in yesterday's update after the failed breakout. It did not break through its primary uptrend so it also does not start any new ranges for today. But it remains in several ranges as all of the prior ones are still valid. First we'll look at resistances, and the 2,672 level will be the first resistance to watch from yesterday's failed breakout and new sideways range (orange). If it breaks or potentially gaps above that, then the next resistances to watch will be at 2,705-2,707 from both its primary uptrend (white) and its prior uptrend (purple).
On a pullback, the first support to watch will be at about 2,647 from its prior uptrend (yellow) that it bounced around today. After that would be its primary uptrend (white) at 2,640 followed by its prior uptrend (blue) at 2,633. If there's a bigger sell-off then its sideways range (orange) would be the next level to watch around 2,615.