The markets had a big gap down this morning after the weekend attacks in Iran which sent oil spiking nearly 12% overnight. The VIX also spiked 27% but markets staged a rally back and the VIX only closed up 8%. The Russell 2000 led the way as it closed up 0.9% after being down almost 1.4% at the lows. The Nasdaq posted a gain of 0.36% while the S&P finished flat with a minor gain of 0.04%. In the afternoon there was a report saying that the Strait of Hormuz was closed and that the IRGC would be targeting any ships that attempt to pass through it. The markets did sell-off sharply on this report intraday and oil spiked with it, but the dip buyers did step in again and overall it was a pretty strong finish for the day.
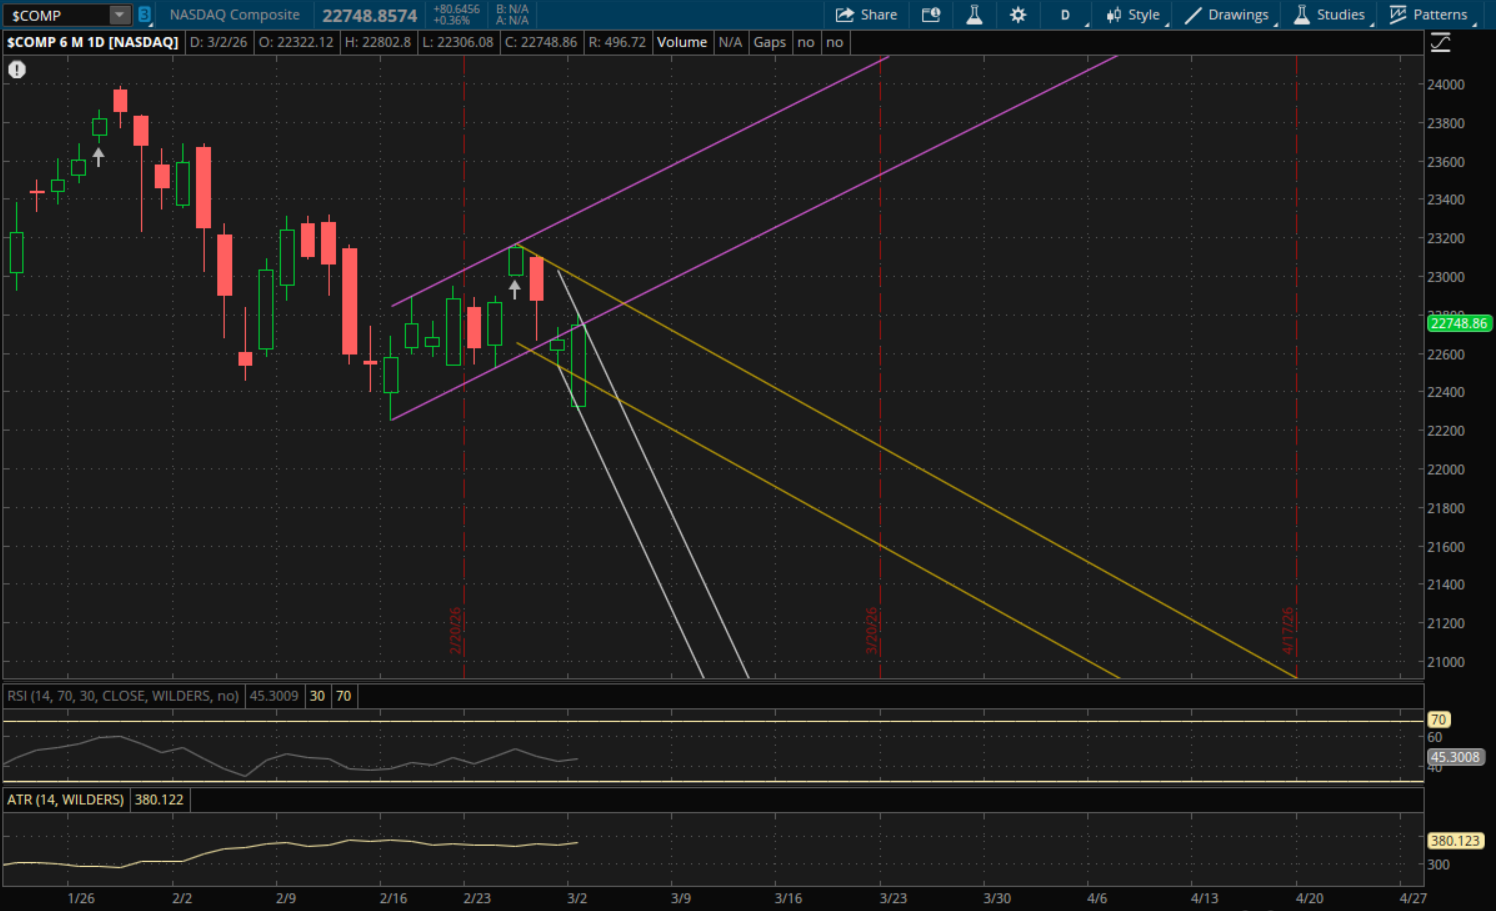
The Nasdaq did gap below its prior primary downtrend that I mentioned in the last update, but it closed well above it which gives it a failed breakdown on the daily. Since it did make a lower low, it still starts a new downtrend. But, odds are it will open above this new downtrend tomorrow based on how strong it finished today. The key level to watch tomorrow will be from this new downtrend (white) which will be support/resistance at about 22,570 tomorrow. The Nasdaq closed at 22,748 today which is well above it. So as long as there is no big gap down again, that level will act as support on a pullback and retest. If it does gap or break below it, then the next support level will be at about 22,415 from its prior downtrend (yellow) and finally its new downtrend (white) would be support at about 22,070 if there is another big sell-off. On a continued bounce tomorrow, the first resistance for the Nasdaq will be right around 22,800 from its prior uptrend (purple) as well as today's high of 22,802. If it clears through that resistance, then the next level to watch will be at about 22,925 from its prior downtrend (yellow).
The S&P also put in a failed breakdown as it gapped below its previous primary daily support and rallied back to close above it. Similarly to the Nasdaq, it starts a new downtrend as it did make a lower low, and it would need to see a gap down tomorrow to open below it again. That key support/resistance level to watch from the new downtrend (white) will be at about 6,865 tomorrow. Since it closed at 6,881 today, odds are also that it will open above it and it will act as support on a retest. However, if it does gap below it, then it will be resistance. The next support levels to watch on a pullback will be from its prior uptrends at 6,855 (yellow) and then 6,843 (blue). If those don't hold then its prior downtrend (purple) comes into play as support at about 6,782. Finally, its new primary downtrend would be the last daily support at about 6,761.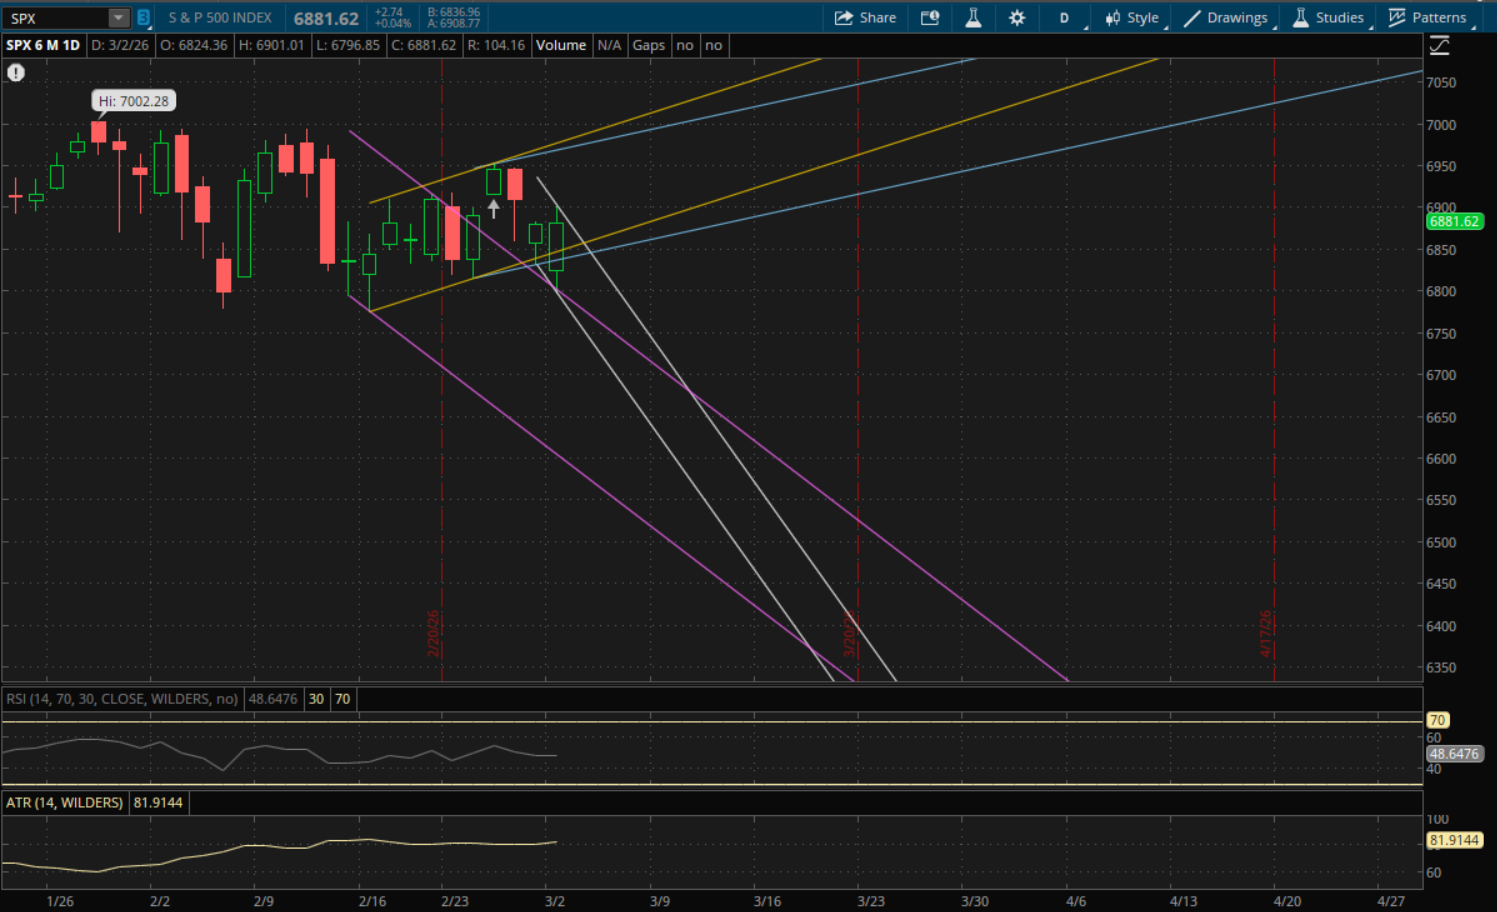
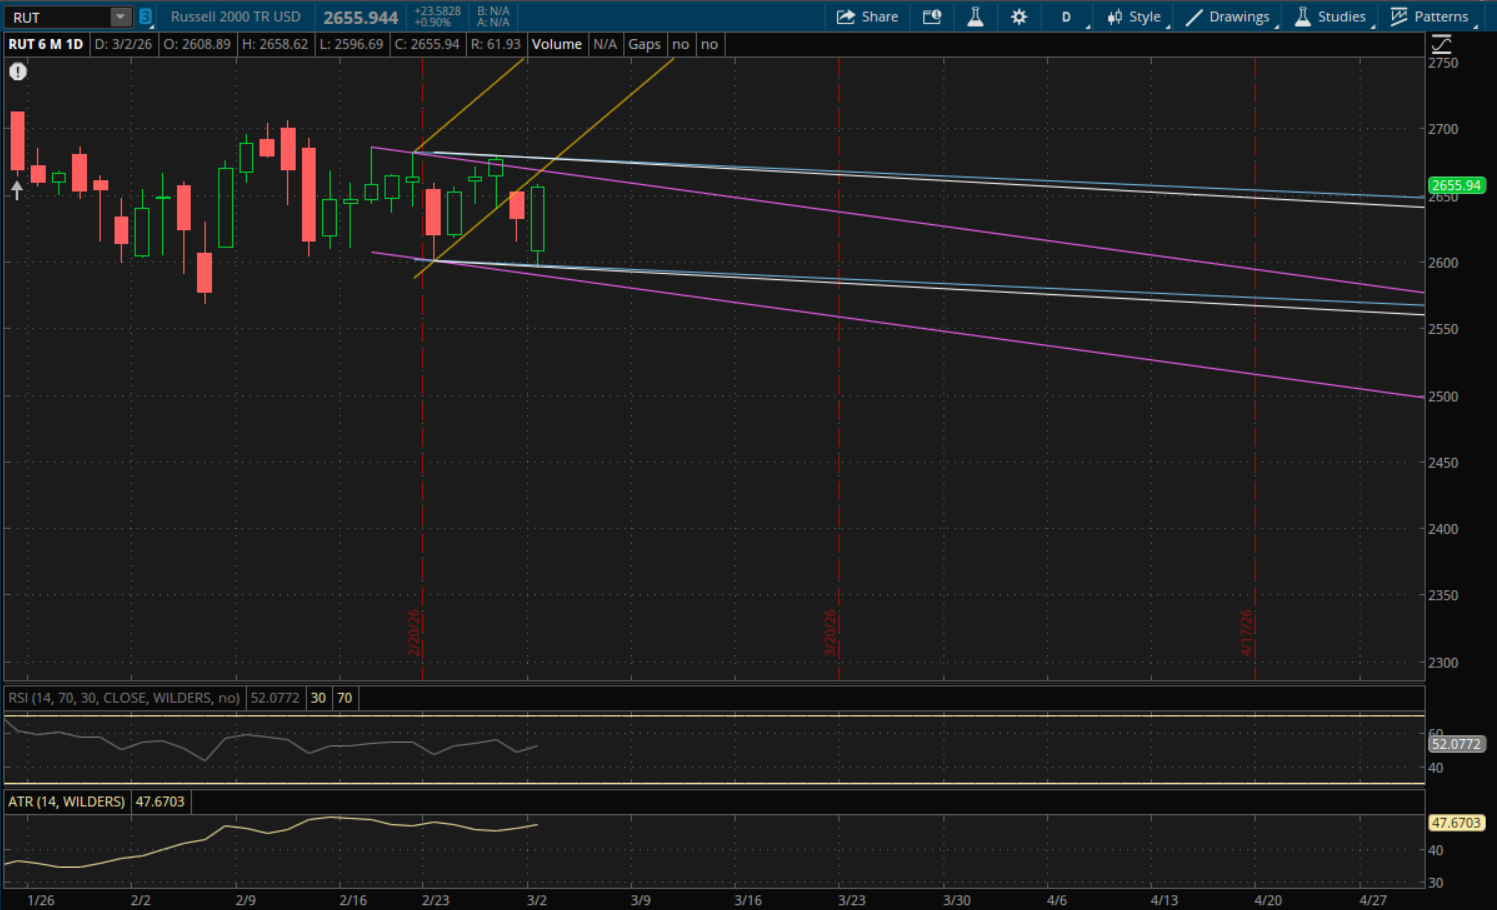
The Russell 2000 bounced right around its primary daily support that I mentioned in the last update which was at about 2,597 today. It had a very slight break through it with a low of 2,596.69. Technically this is a failed breakdown as it did have that slight break through it. The new range (white) it starts is still a new downtrend since it did make a lower low, and this new range is almost identical to the previous one (now blue) which is essentially a sideways range. Its prior trends remain intact as it didn't break through any of those.
So the next resistance to watch will be from its prior downtrend (purple) at about 2,667. After that, its new primary range (white) and prior downtrend (blue) will both be at about 2,677-2,678. If it breaks through both of those, its last daily resistance would be from its prior uptrend (yellow) at 2,680. If we get another sell-off then supports to watch will be at 2,596-2,597 from both its new primary range (white) and prior downtrend (blue). If it breaks through both of those then its last support will be from its prior downtrend (purple) at 2,588.