The Nasdaq lagged this week as it posted a loss of 0.9% while the Russell 2000 gained 2.1% and the S&P finished roughly flat with a decline of 0.1%. Markets have continued to rotate out of tech, especially software and mega caps. Meanwhile RSP, the equal weight S&P ETF, reached new all time highs. Before Friday's big rally back in markets, the VIX hit a high of $23.10, its highest level since last November. It has since come back down, but is still elevated at $17.76. Most of the big tech earnings are now out of the way with NVDA left to report on February 25th. The January employment situation (jobs report) that was supposed to be released yesterday morning got delayed due to the partial government shutdown. The BLS rescheduled the release of this data for this Wednesday, February 11th. So this will be the big data catalyst for the week to watch. We will also be going into a 3 day weekend with markets closed the following Monday, February 16th, for President's day.
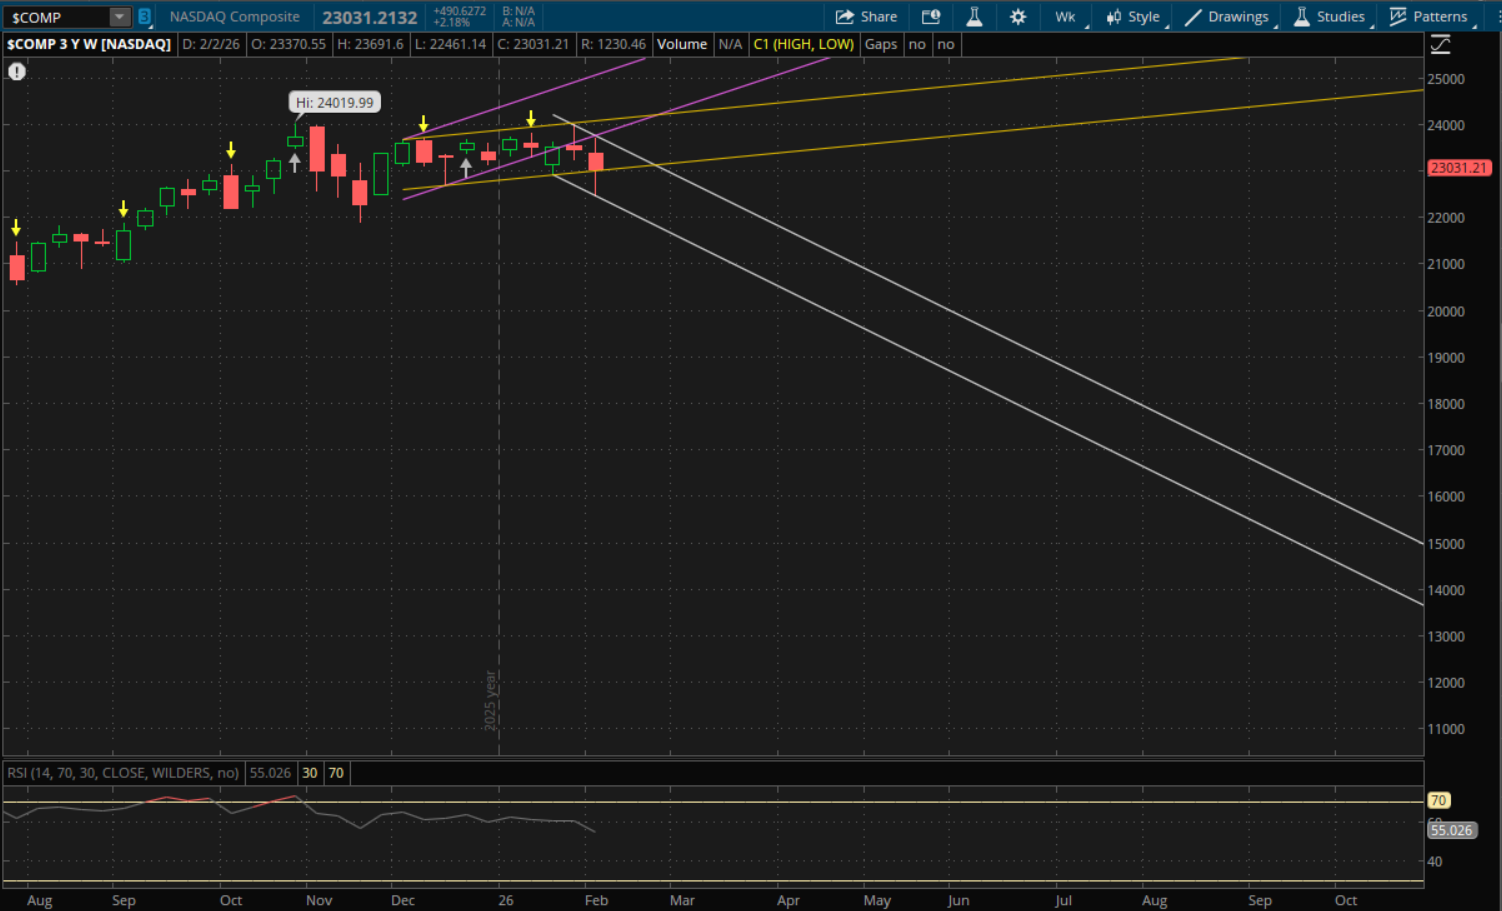
There was some technical damage done during the selloff this week, mostly in the Nasdaq as it broke below its big weekly support around 23,000 that I mentioned in last week's update. Now it did manage to reclaim that support during Friday's rally back, closing at 23,031. However, it was not a strong finish as it closed just a hair above that weekly support. Technically this is a failed breakdown as buyers stepped in and it closed back above support. But, since it made a lower low this week, it still starts a new downtrend. So I wouldn't say it's out of the woods just yet.
The first big level to watch for next week will be at 23,050 from the prior uptrend (yellow) and failed breakdown from this week. Since the Nasdaq closed at 23,031, it needs a small gap up to open above this 23,050 level in which case it will be support on a retest of the failed breakdown. However, if it fails to gap up above that level, then it will be resistance and bears would still be in control. If it does open above it, the next resistance level to watch will be at about 23,525 from its new downtrend (white) that it started. If it can clear through that level, then the next resistance would be from its prior uptrend (purple) at about 23,925. After that there would be more resistance at about 24,130 from its prior (yellow) uptrend.
If it fails to open above the key 23,050 level on Monday, then that will be resistance on a retest. Then the next support to watch will be from its new downtrend (white) at about 22,235. If that does not hold either, then it will start a new downtrend going into the following week but we will need to see how it closes to determine whether it's a confirmed breakdown or failed breakdown.
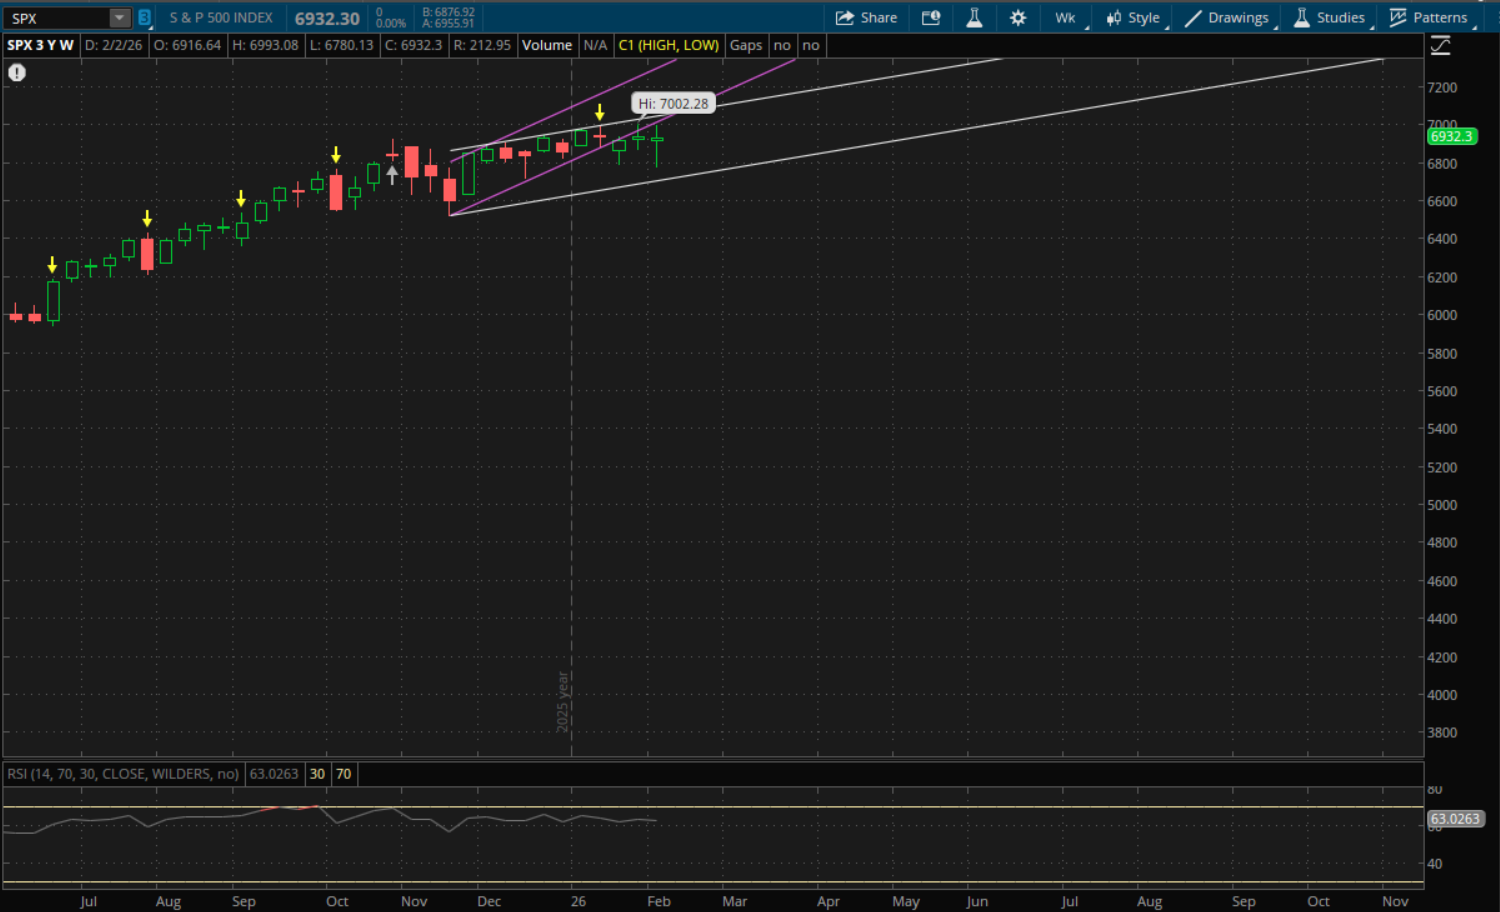
The S&P didn't break through any support or resistance levels on the weekly time frame so it doesn't start any new ranges for next week. It did break through monthly support at about 6,860. Now we just have to wait and see how it finishes this month. But back to the weekly, it still remains in its same primary uptrend (white) and that support for next week will be at about 6,720-6,725. Resistance from the same primary uptrend and its previous uptrend (purple) will both be at at about 7,060-7,065.
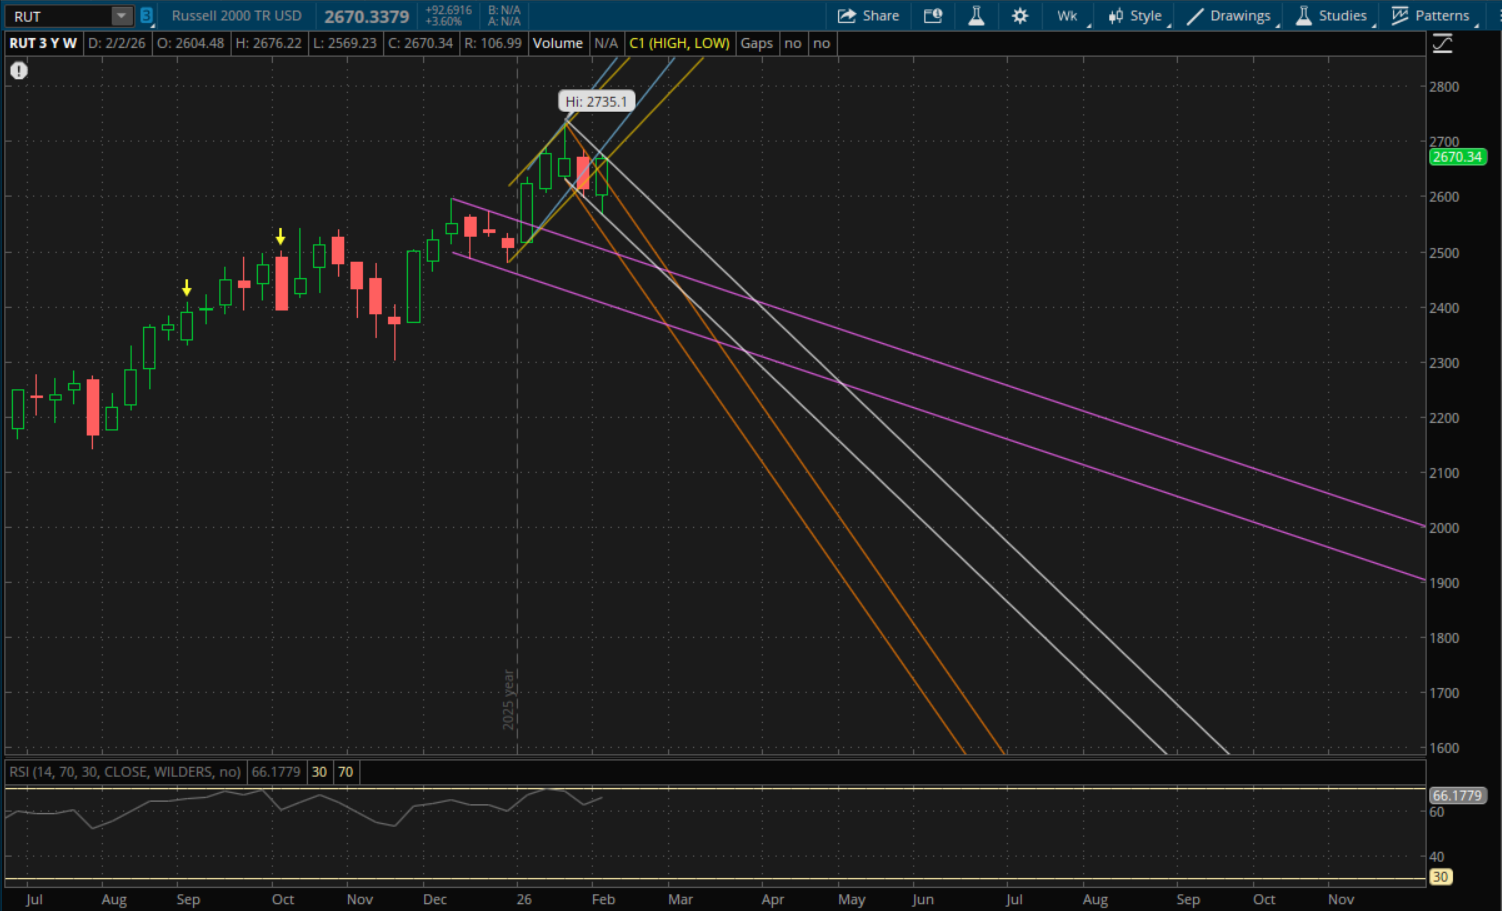
The Russell 2000 broke and closed above the downtrend it started last week, since it did make a lower low this week before rally back, it still starts a new downtrend. All of its prior trends are still valid as well so there are a lot of levels to watch for next week. The first support from its new downtrend (white) will be at about 2,642 on a pullback (assuming it doesn't gap below it on Monday - in which case it becomes resistance). After that, its prior downtrend (orange) will be support at about 2,585. And then its primary support (white) will be support again around 2,534. There are more supports below this as well, but they're unlikely to come into play. Resistances to watch will be at about 2,698 from its first prior uptrend (yellow) and then there would be more at 2,732 from its second prior uptrend (blue).