The markets continued yesterday's recovery with tech leading the way as the Nasdaq closed up 1.29%. Small caps were also strong with the Russell 2000 closing higher by 1.06% followed by the S&P which closed up 0.78%. Broadcom (AVGO) also reported earnings after the close and is currently up almost 5% which should help semis and tech recover even more tomorrow if it holds. With today's rally the VIX closed down over 10% but still remains elevated, just above $21. Tomorrow morning we will get jobless claims data with 215,000 expected which will be in focus after recent weak jobs data.
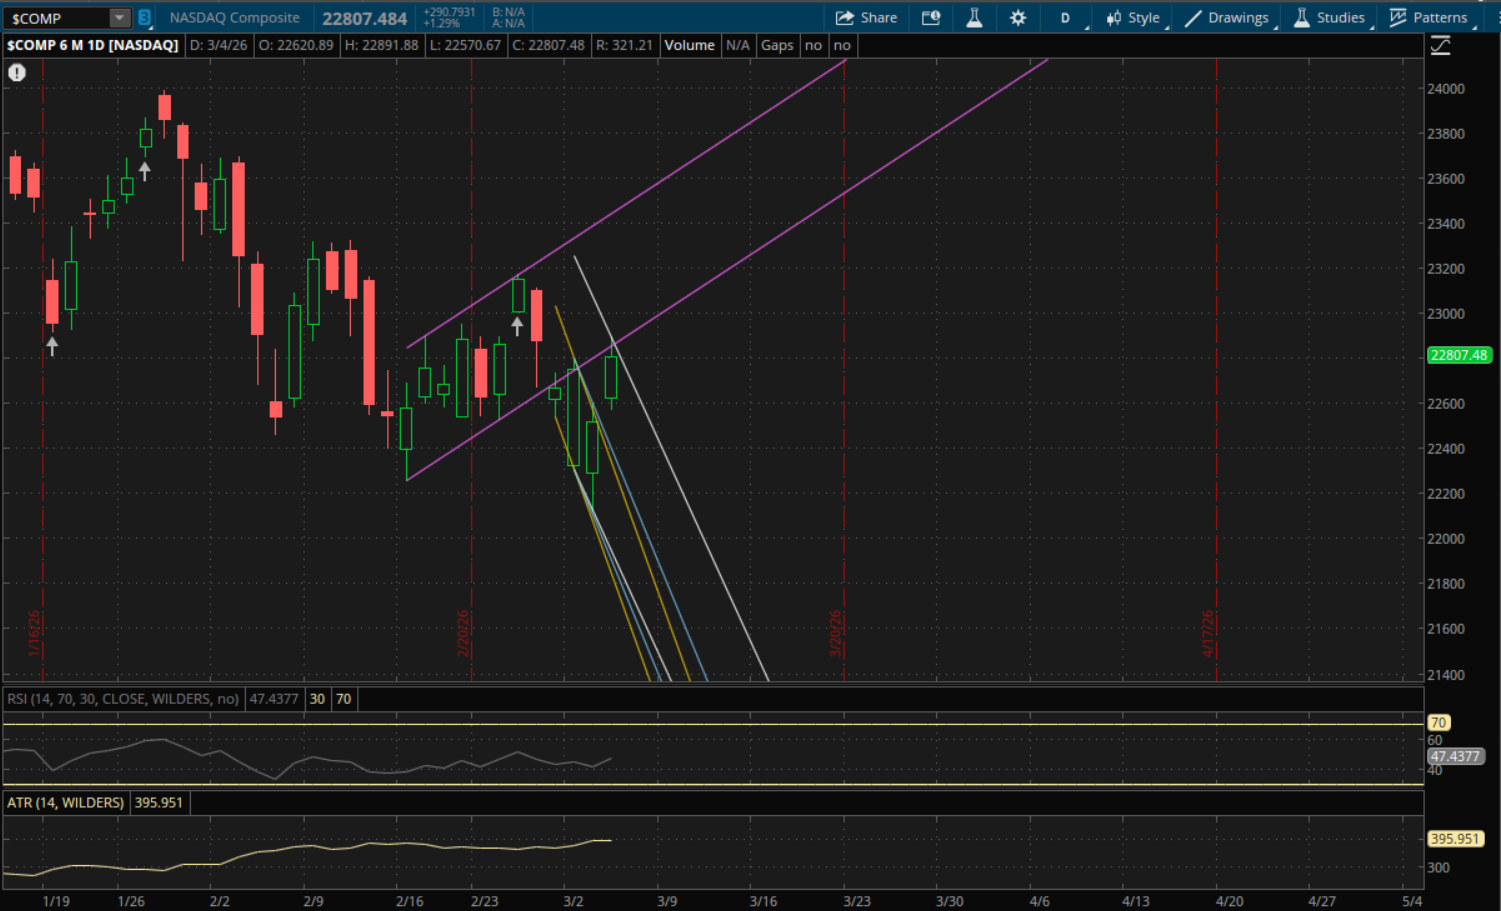
This morning we got a nice gap up in the markets to get them over their prior downtrends. All of the indexes opened and closed above them, but for the Nasdaq it still starts a new downtrend going into tomorrow. Its new, primary downtrend (white), will be at about 22,710 tomorrow which it closed well above today at 22,807. So as long as there's no big gap down below 22,710 tomorrow, this area will act as support on a pullback. If it does gap or break below it and we get a significant sell-off again, the next support to watch will be from its prior downtrend (blue) at 22,200 followed by its next prior downtrend (yellow) at 22,100. If neither of those hold, then its primary downtrend (white) comes into play again at about 21,765 but this would require a pretty big sell-off as it's 4.5% away. If we get a continued bounce, the next resistance for now remains at its prior uptrend (purple) which is at about 22,910. There is also weekly downtrend resistance at about 22,965.
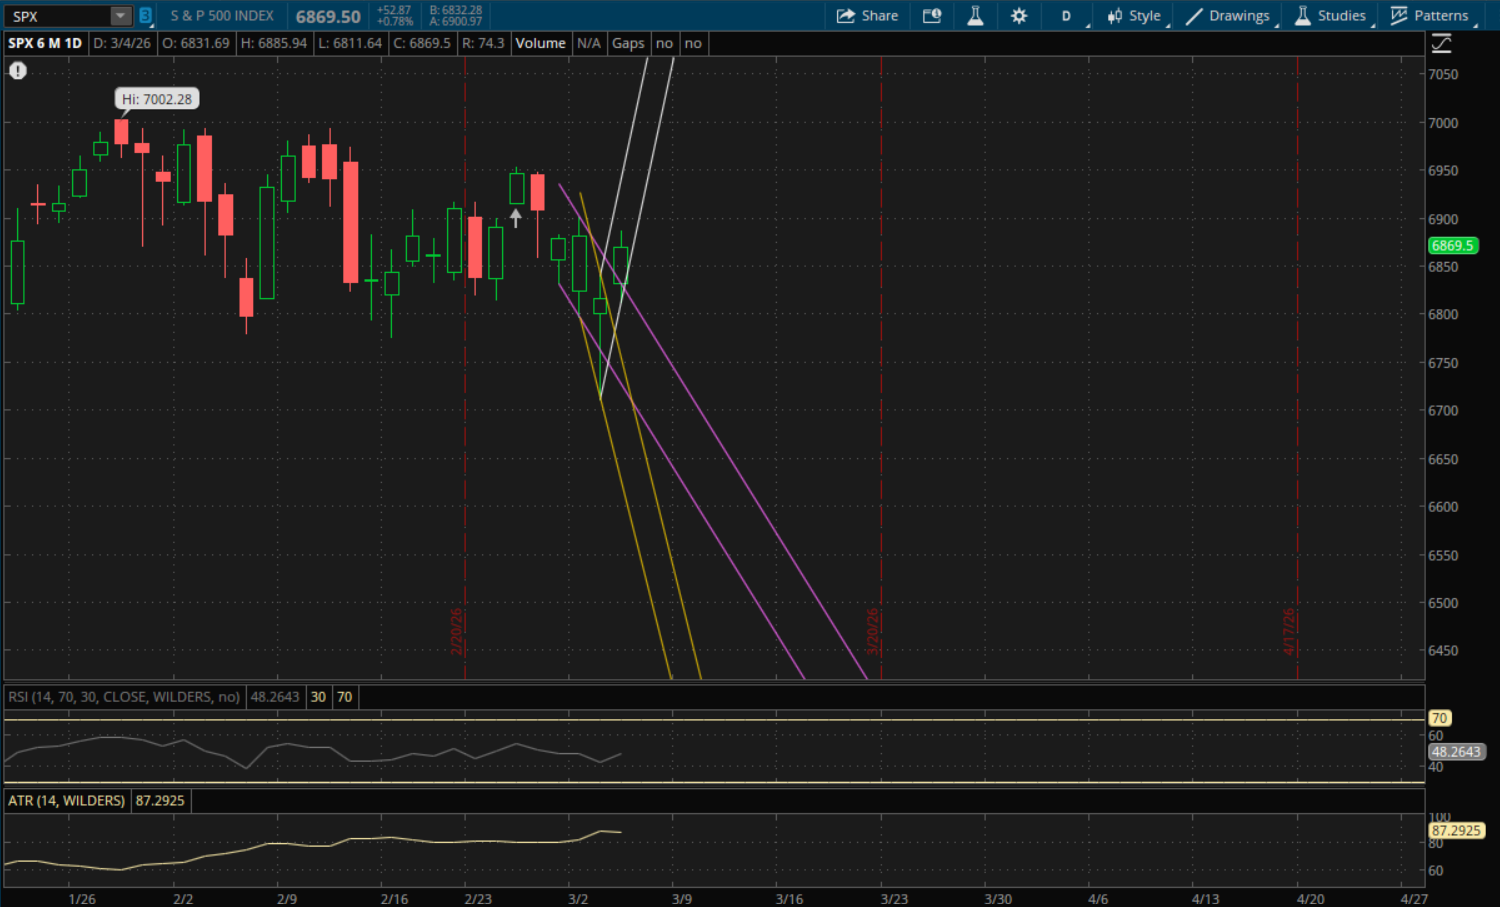
Unlike the Nasdaq, the S&P starts a new uptrend with today's breakout. However, it will need to gap up significantly tomorrow in order to open above this new uptrend (white). That key support/resistance level will be at about 6,915. With today's close of 6,869.50 it will need to gap up almost 0.7% to do that so odds are that it opens below/outside of it in which case it will be resistance on a rally attempt. If it does manage to get that big gap up above it, then it will be support on a pullback. If that happens, the next resistance would be significantly higher above 7,000. The more likely scenario is that it does not open above it and then the next support on a pullback would be from its prior downtrend (purple) at 6,795 with the bottom end of this same range at 6,690 as the next support in the event of another big sell-off.
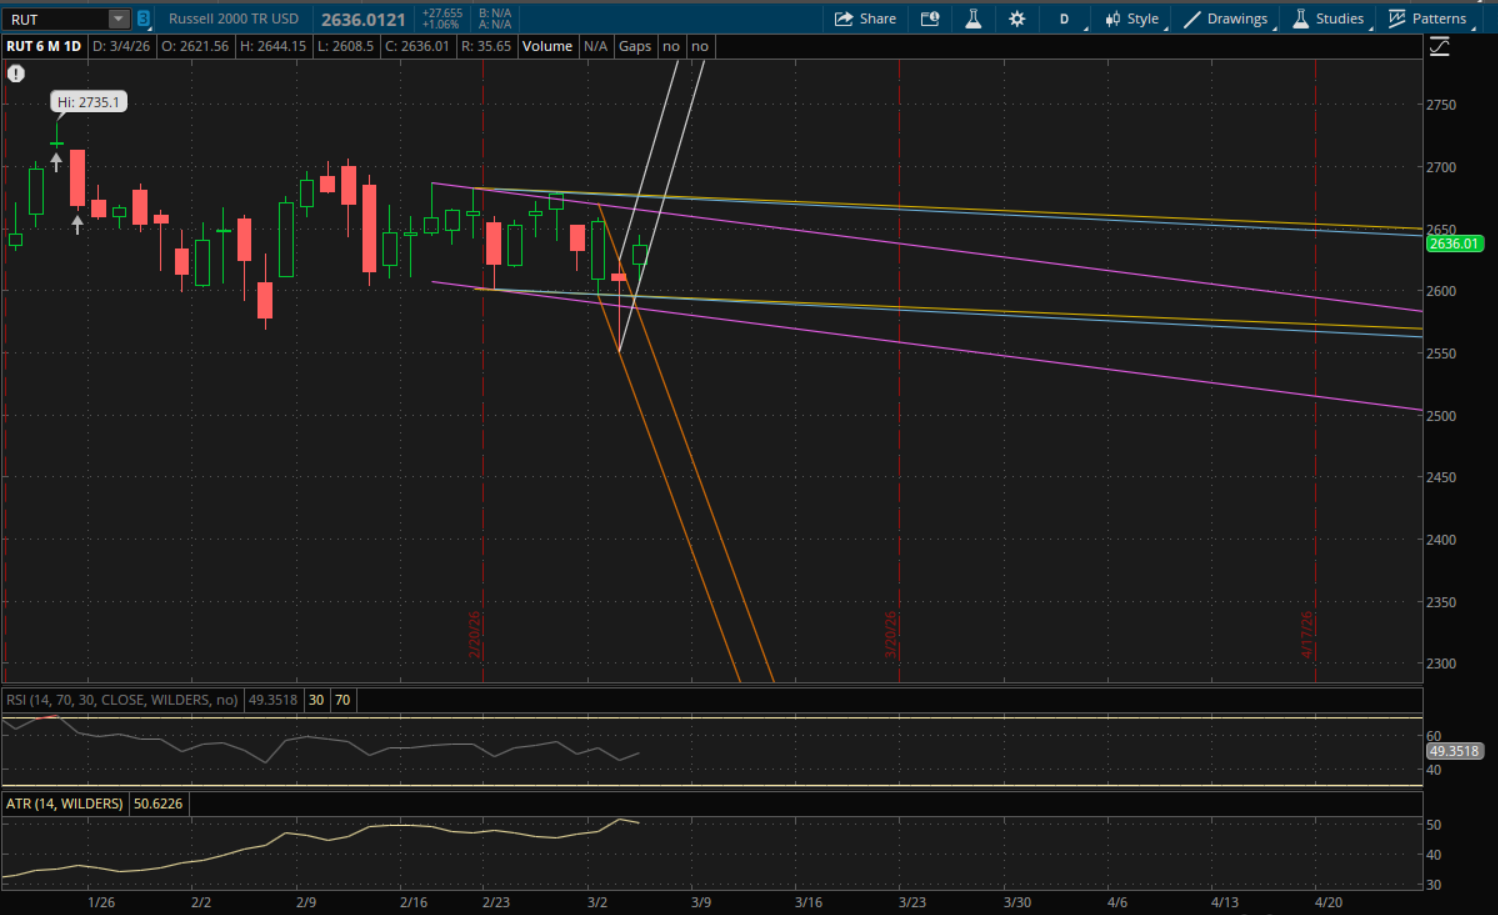
The Russell 2000 also starts a new uptrend with today's break and close above its prior downtrend. But it's in the same situation as the S&P where it needs to see a big gap up tomorrow in order to open above this new uptrend support (white). That level will be at about 2,667 which is about 1.2% away, it's possible but improbable. Odds are it opens below/outside of it in which case that 2,667 area would be resistance on a rally attempt. On the off chance that it does get that big gap up to open above it, or if it breaks through it with a rally, then the next resistance level to watch will be at 2,675-2,676 from both of its prior downtrends (blue and yellow). And in the event of an even larger rally its new uptrend (white) would be resistance at 2,740. However the odds are in favor of an open below this new uptrend, and the next supports to watch on a pullback will be at 2,594-2,595 again from both of its prior downtrends (blue and yellow). After that there would be more support at 2,584 from its purple downtrend. Lastly the 2,532 area would also be support from the downtrend it broke through today (orange) if we were to get another big sell-off.