Last week the markets closed lower with the Nasdaq leading the way as it fell 2.1% while the S&P lost 1.4%. Small caps held up the best, but the Russell 2000 still closed down 0.9% for the week. The VIX on the other hand closed the week up 16% with the market pullback and it's now up 42% this year as volatility remains elevated. There was some key data last week with a better than expected January jobs report along with cool CPI report on Friday, but markets still struggled to rally. This week is a short trading week with markets closed tomorrow for President's Day but there will still be some key data to watch with month over month retail sales and PCE (personal consumption expenditures) on Friday which is the Fed's preferred inflation gauge. There will also be the FOMC minutes Wednesday afternoon, though it usually isn't much of a market mover.
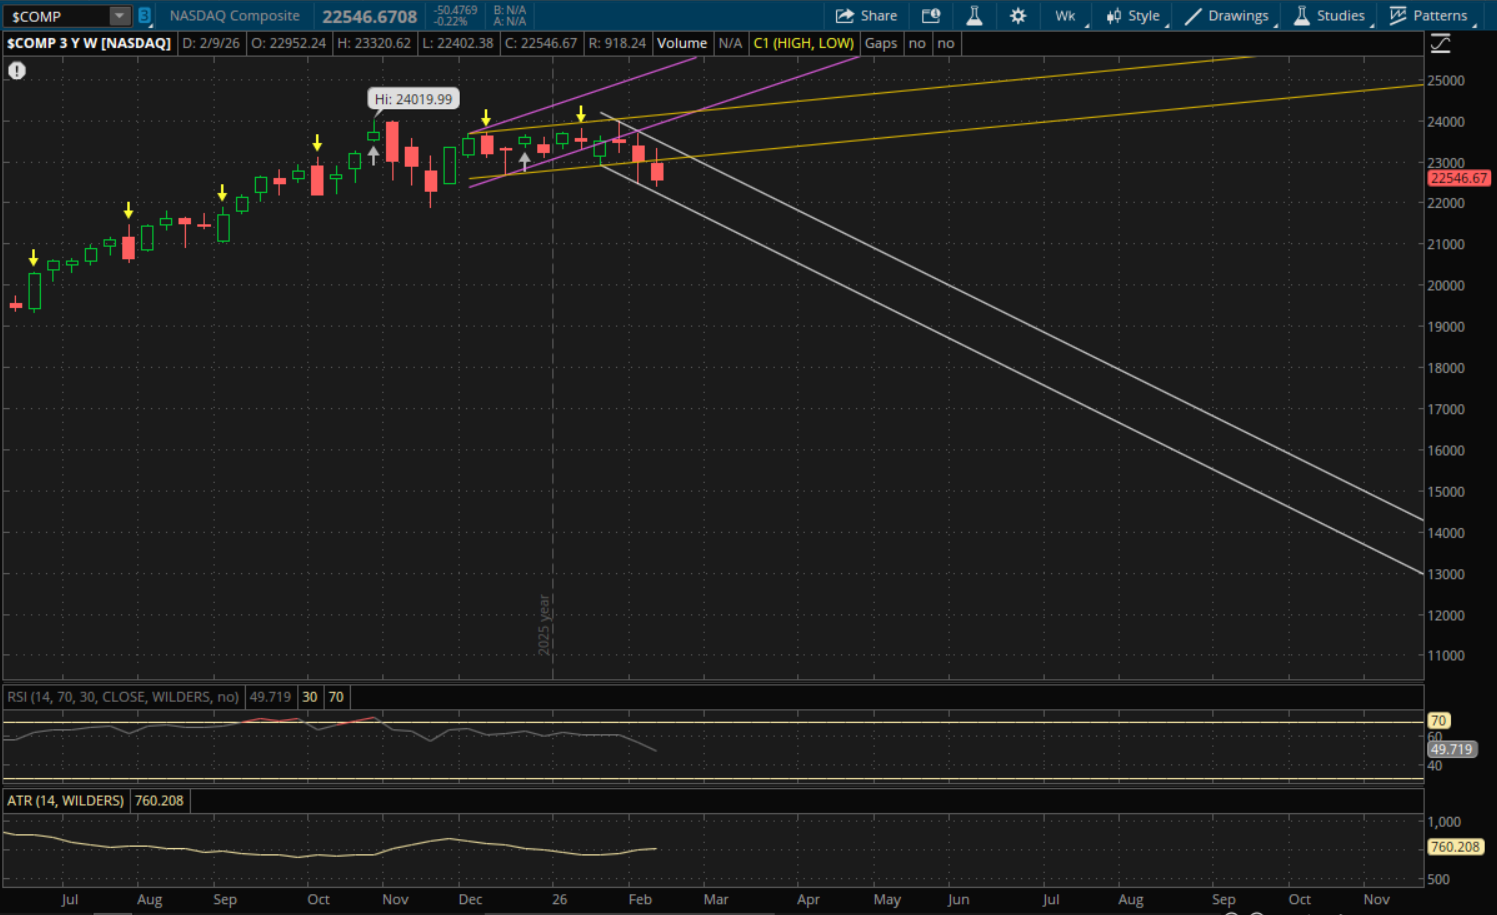
Looking at the market levels for next week, the Nasdaq continues to look bad here as it started a new weekly downtrend last week which it remains in. It didn't break through its primary downtrend (white) so it doesn't start any new ranges. The next weekly support to watch will be from this same primary downtrend right around 22,000. If that does not hold then we will need to see how it closes for the next trend. On a bounce, the first resistance to watch will be at 23,100 from its prior uptrend (yellow). After that, its new primary downtrend will be resistance at about 23,300.
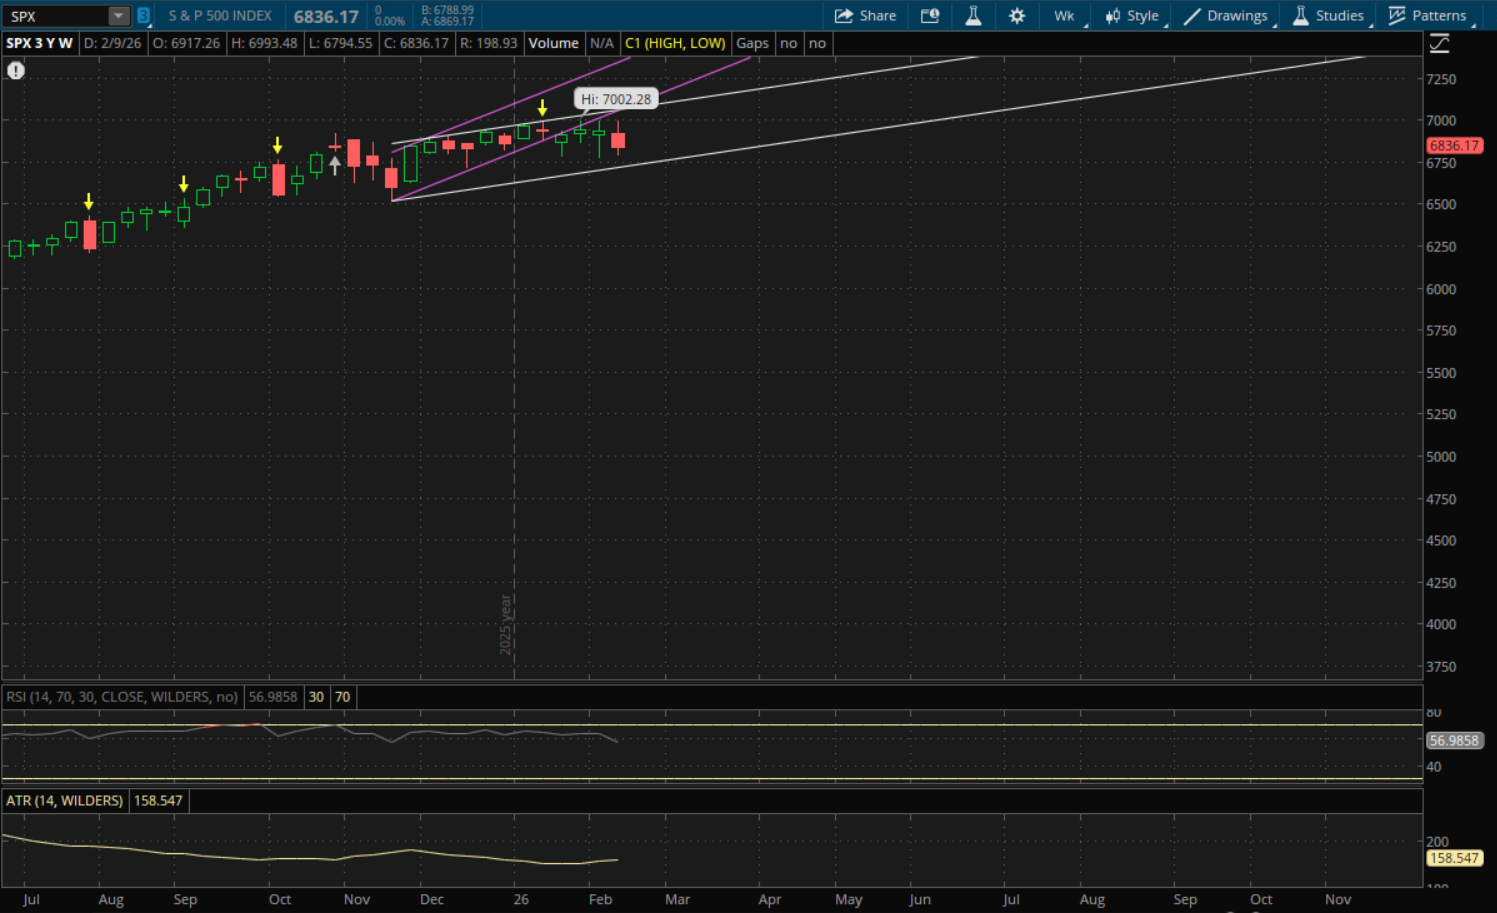
The S&P also did not break through any trends last week so it doesn't start any new ones going into this week and it remains in its primary weekly uptrend (white). That level will now be support at 6,735-6,740 for this week while resistance from this same uptrend will be at about 7,080. If there is a big rally and break through that 7,080 level then its prior uptrend (purple) will come into play again which will be resistance at about 7,105.
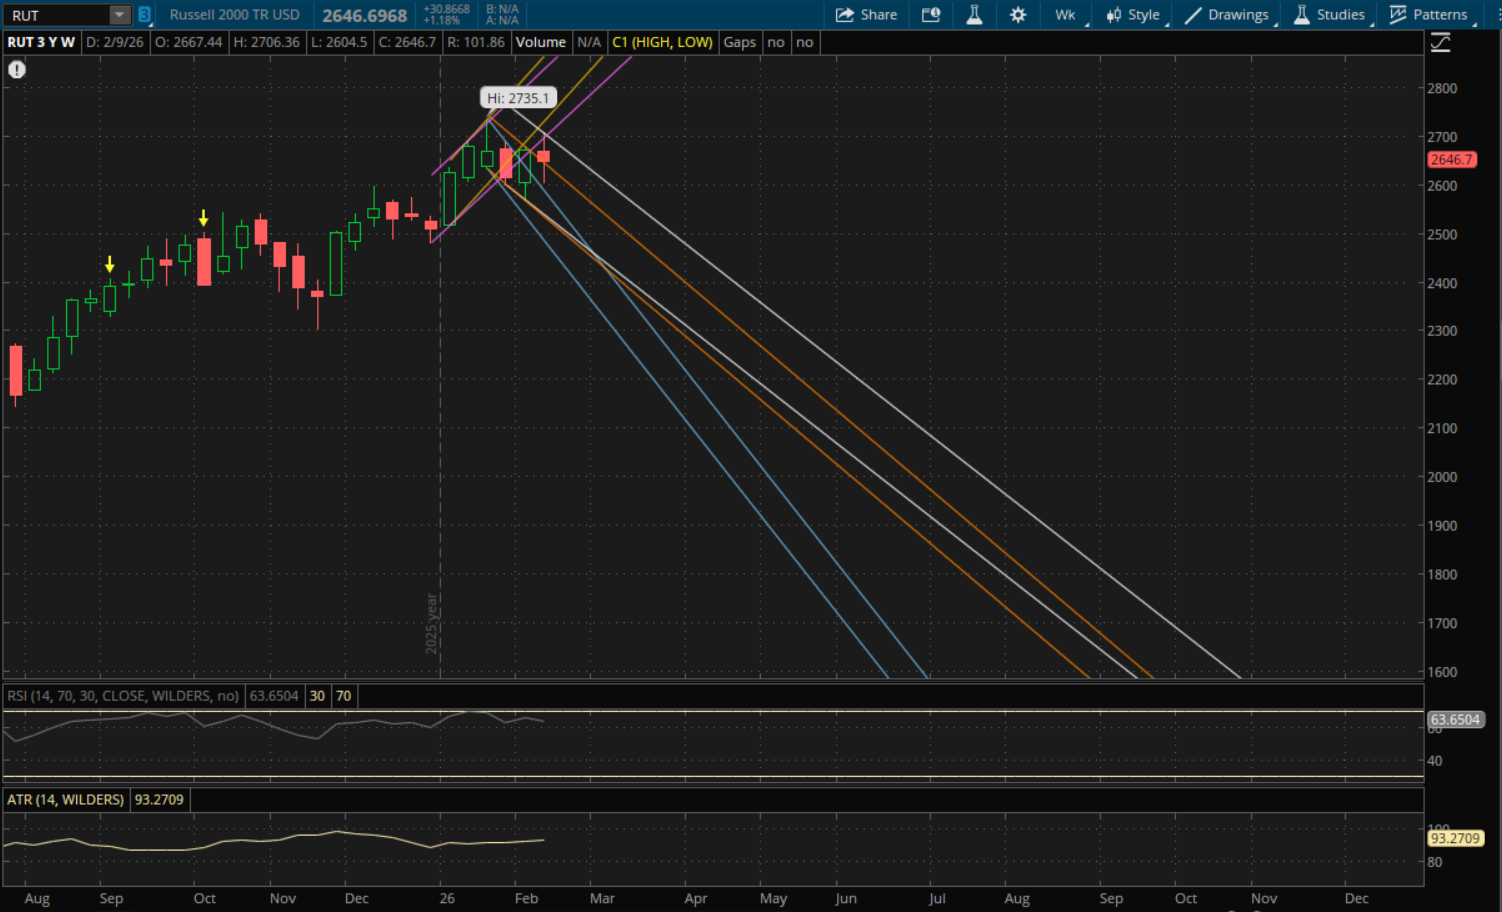
The Russell 2000 has a lot going on here as it closed just above its last primary downtrend (orange) but still starts a new downtrend here and all of its prior trends are still valid for now. The first resistance to watch will now be from its new primary downtrend (white) which will be at 2,675. If it breaks through that then its prior uptrend (purple) will be resistance at about 2,735 which is back to its all time high from last month. Above the all time high, the next resistance would be at about 2,775 which is from its previous uptrend (yellow).
Supports to watch on a pullback will be at 2,610 from last week's downtrend (orange) that it closed above. After that, its prior downtrend (blue) will be support at about 2,537 followed by its new downtrend (white) around 2,507.