Market analysis 3/17/2024
The markets closed lower last week which was the second week in a row with a lower close. For the S&P and Nasdaq, this was the first back-to-back lower closes since the October 2023 bottom. The Russell 2000 also had consecutive down weeks which was the first since the beginning of the year. However, they weren’t big pullbacks as the S&P is only down 1.4% from all time highs while NDX (Nasdaq 100) is down 3.3% from all time highs. The Russell 2000 on the other hand never made new all time highs with the rest of the markets.
There have been some recent technical warning signs which I mentioned last week, especially for the Nasdaq. On weekly time frames there has been a confirmed bearish divergence on NDX as well as QQQ and Nasdaq futures (NQ). The bearish divergence showed up the prior week when NDX made new all time highs but reversed to finish the week in the red. It got confirmation as the weekly RSI failed to make a new high with price. With last week’s pullback, weekly RSI is also now making lower lows without price, which continues to signal further downside. Price is also signaling further downside as the Nasdaq finished just off of the lows of the week. While the S&P and Russell 2000 also finished weak on a weekly time frame, they do not have the same bearish divergences as the Nasdaq.
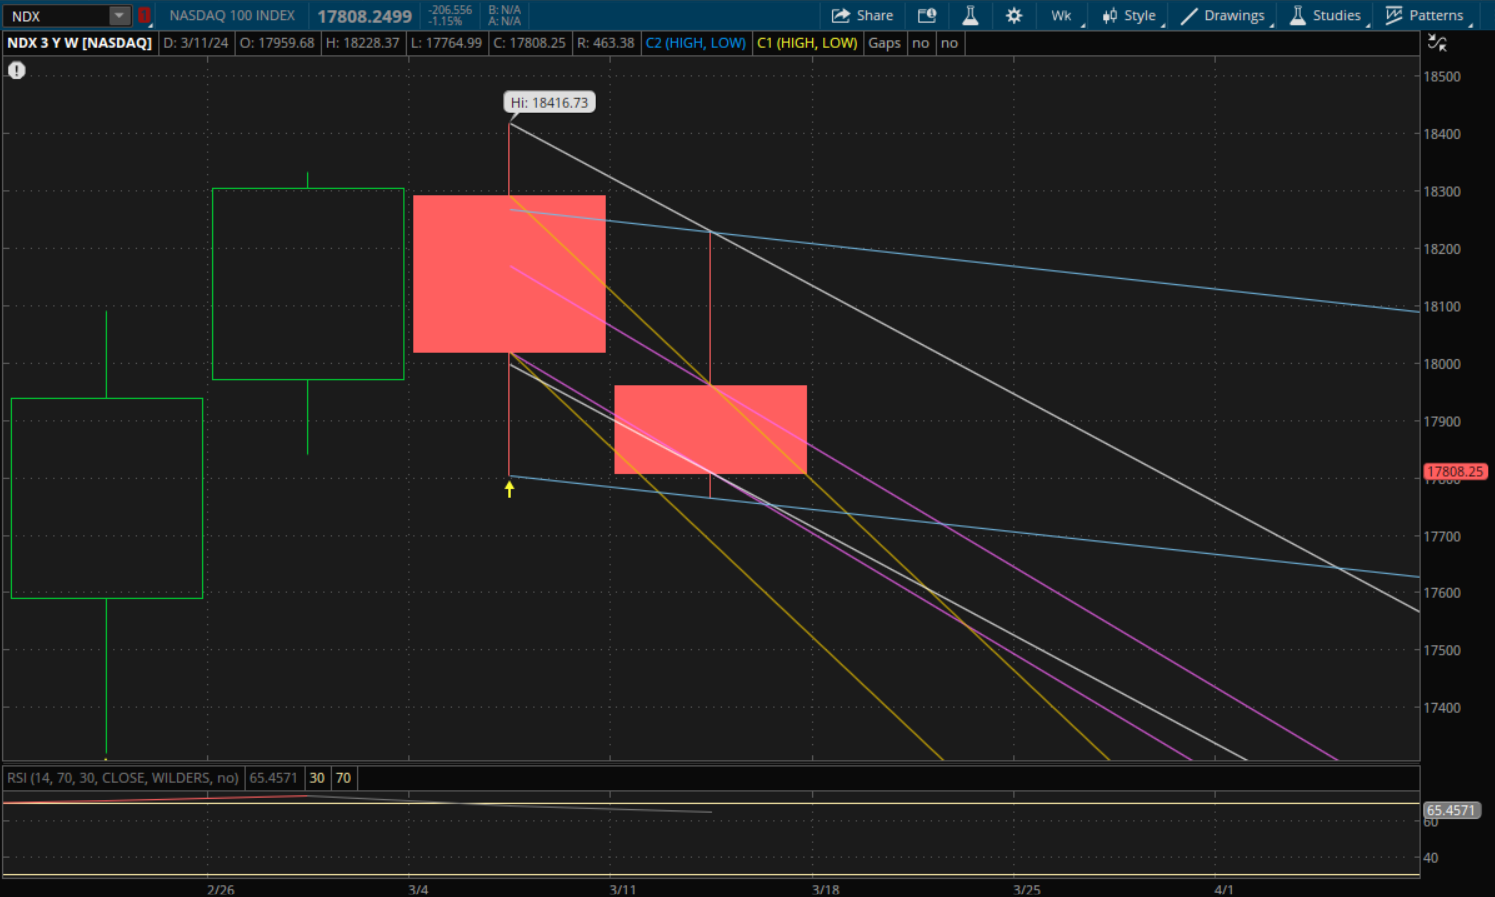
Looking at a weekly time frame for NDX first, here are the support and resistance levels to watch this week:
Supports: 17,764.99 (last week’s low), 17,750, 17,725, 17,620-17,630, 17,600, 17,570-17,575, 17,425 and 17,350-17,360
Resistances: 17,860-17,870, 17,990-18,000, 18,015, 18,040, 18,185, 18,210 18,228.37 (last week’s high) and 18,335-18,340
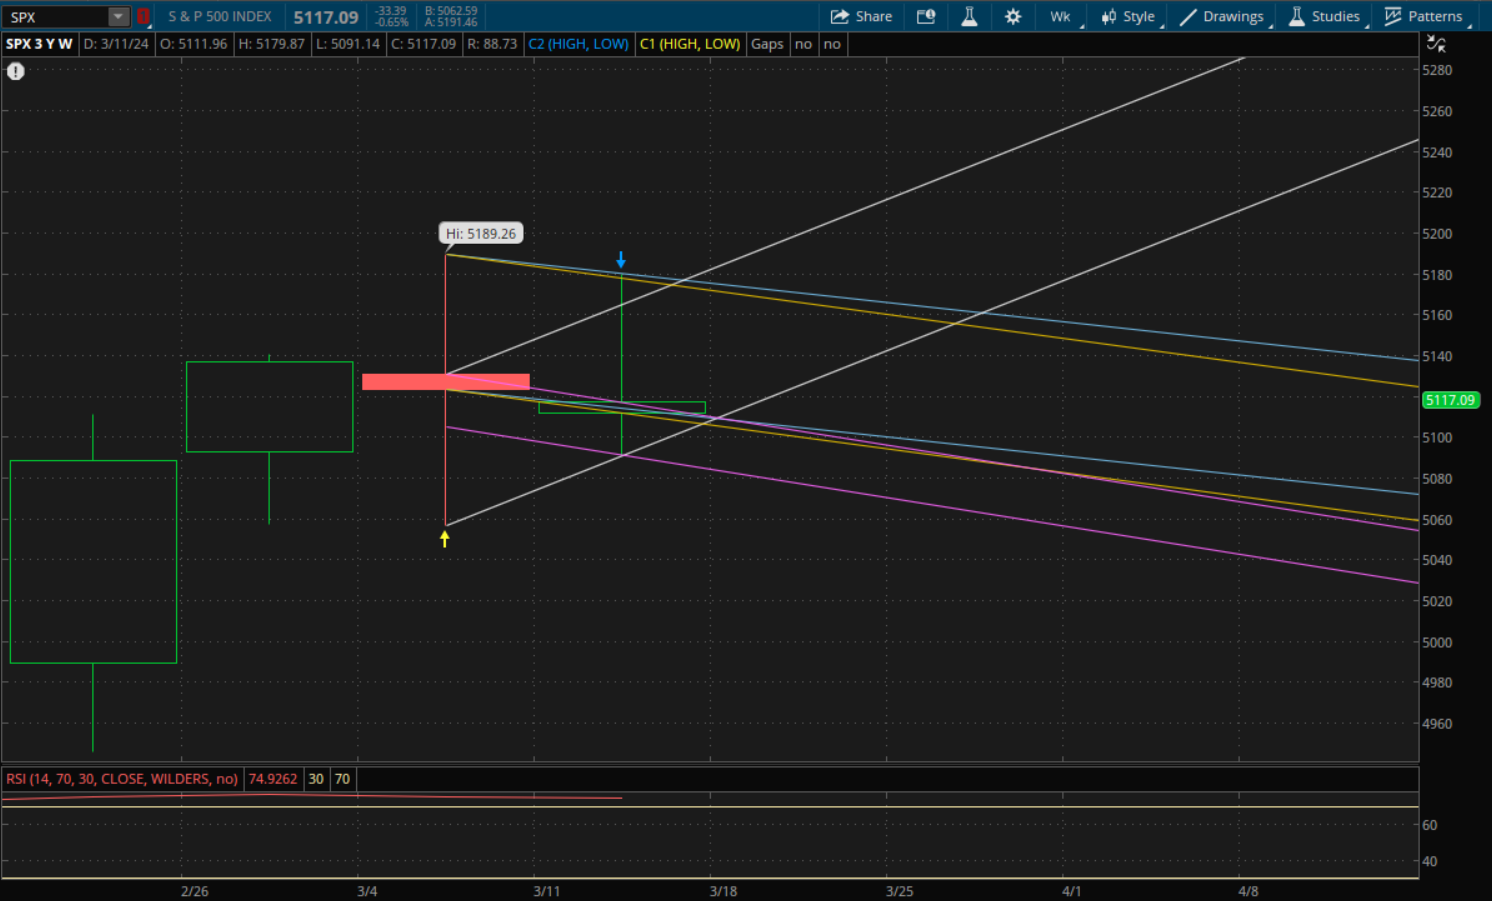
The S&P finished the strongest last week as it was essentially flat. The following are weekly support and resistance levels to watch for this week:
Supports: 5,100-5,105, 5,091.14 (last week’s low), 5,081-5,082, 5,077, 5,037-5,038 and 5,028-5,030
Resistances: 5,125-5,126, 5,165-5,170, 5,179.87 (last week’s high), 5,189.26 (all time highs), 5,200, 5,215 and 5,255-5,260
Lastly, here are weekly support and resistances for the Russell 2000:
Supports: 2,036-2,037, 2,032-2,033, 2,026-2,029, 2,024, 2,017.28 (last week’s low), 2,005-2,006, 2,003, 1,995, 1,985-1,986, 1,980-1,981
Resistances: 2,044-2,045, 2,048-2,049, 2,053-2,054, 2,064 and 2,080.19 (last week’s high)
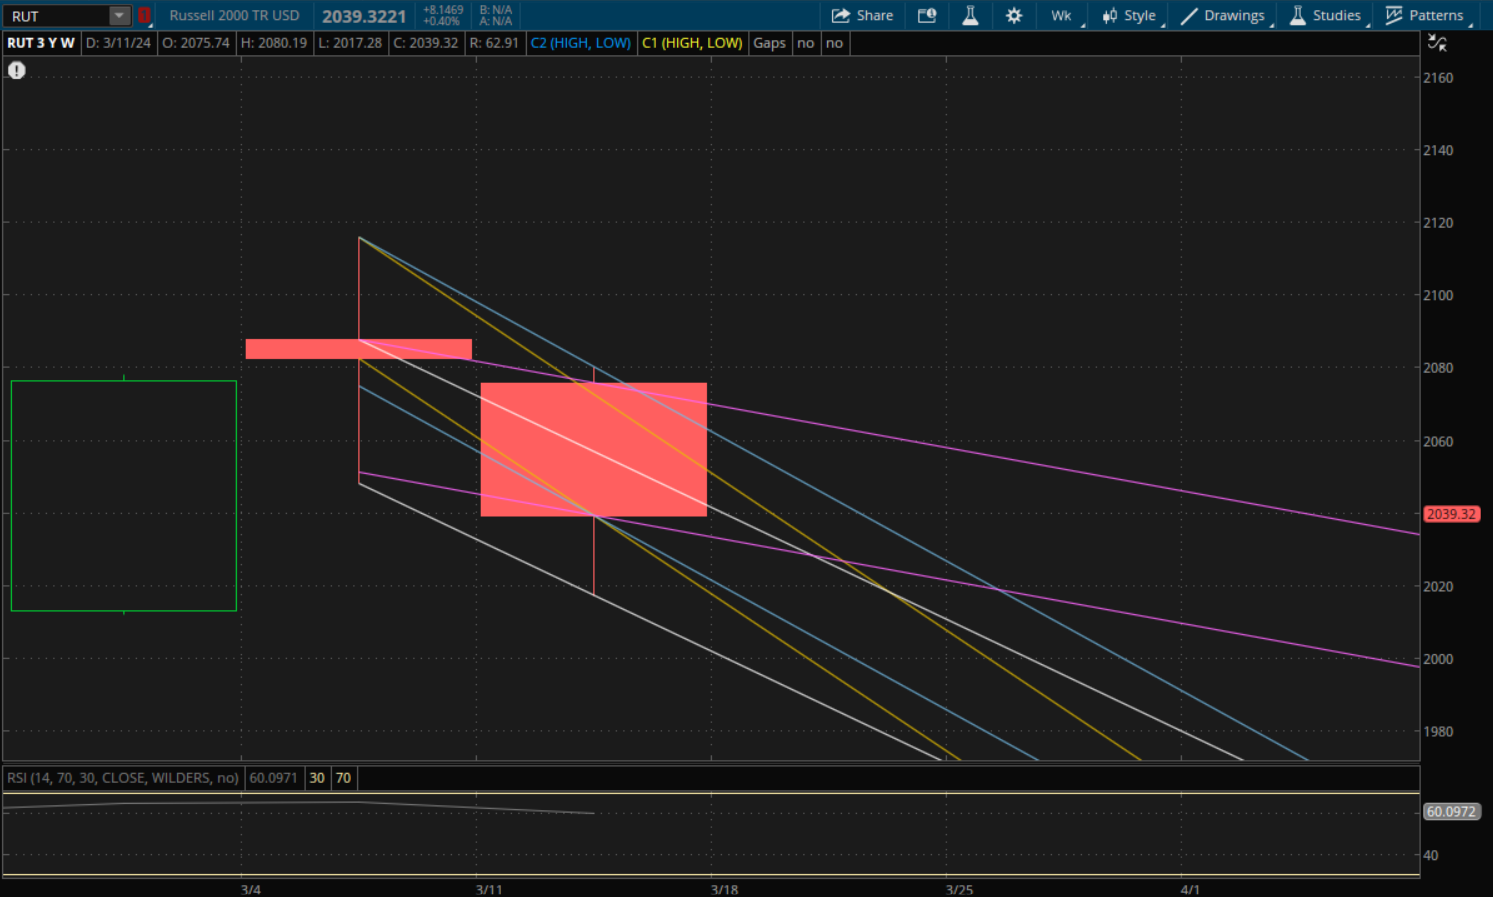
The path of least resistance is actually higher for RUT. And on Friday small caps outperformed with RUT up 0.40% while the S&P was down 0.65% and the NDX was down 1.15%. So it will be interesting to see if we finally get a rotation into small caps and out of everything else for a while.
There are some key events this week with the Fed as the FOMC rate decision is coming up on Wednesday at 2:00 PM Eastern which will be followed up by Jerome Powell’s press conference at 2:30. Powell will also be speaking on Friday at 9:00 AM Eastern at the “Fed Listens” event where he will discuss current economic conditions and how the economy has changed since the pandemic.
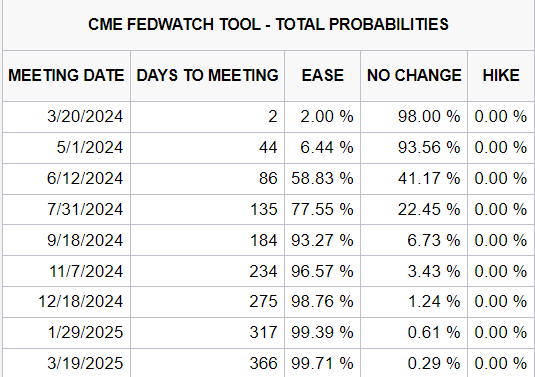
As for Wednesday’s rate decision the market expects the Fed to keep rates unchanged with only a 2% chance of a cut. Markets also aren’t pricing in a cut for May as there is only just a 6.44% probability. At the moment June is the first meeting where a cut is expected with current odds at 58.83%, however this has declined since the beginning of the year as it started out at 100% and is down from 63.3% at the beginning of March. And odds will likely change again depending on what Powell says this week.
Market Analysis 3/2/2024
The markets continued their rally in February with SPY now up nearly 8% year-to-date and QQQ up almost 9%. After a 6.5% correction for small caps to start the year, IWM has begun to participate with the rest of the market rally as it hit new highs for 2024 this week and is now up about 2.5% for the year.
Last month we saw a hot CPI report which seemed to just be a speed bump for the market rally as it the dip was bought again. And this past week we got an in-line PCE report (the Fed’s preferred inflation gauge) which appeared to ease the worries of inflation ticking back up. This sent rates lower again and helped spark another strong market rally to close out the week.
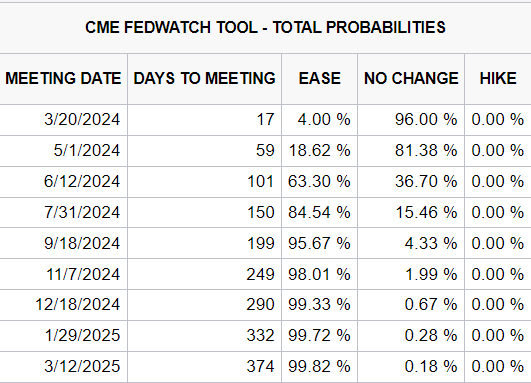
The in-line PCE report also increased odds for future rate cuts, but the market still expects the first cut in June with a 63.6% chance. This is a drastic change from the beginning of the year as the first cut was expected in March and there were a total of 7 cuts being priced in for the year. Since the beginning of the year, March odds of a rate cut have fallen from 86.5% down to just 4% now. May also appears to be off the table with just a 18.62% chance. Now, markets are pricing in 5 cuts for the year. However, the Fed has said they still only expect 3 cuts this year, so the markets still seem to be a bit too optimistic.
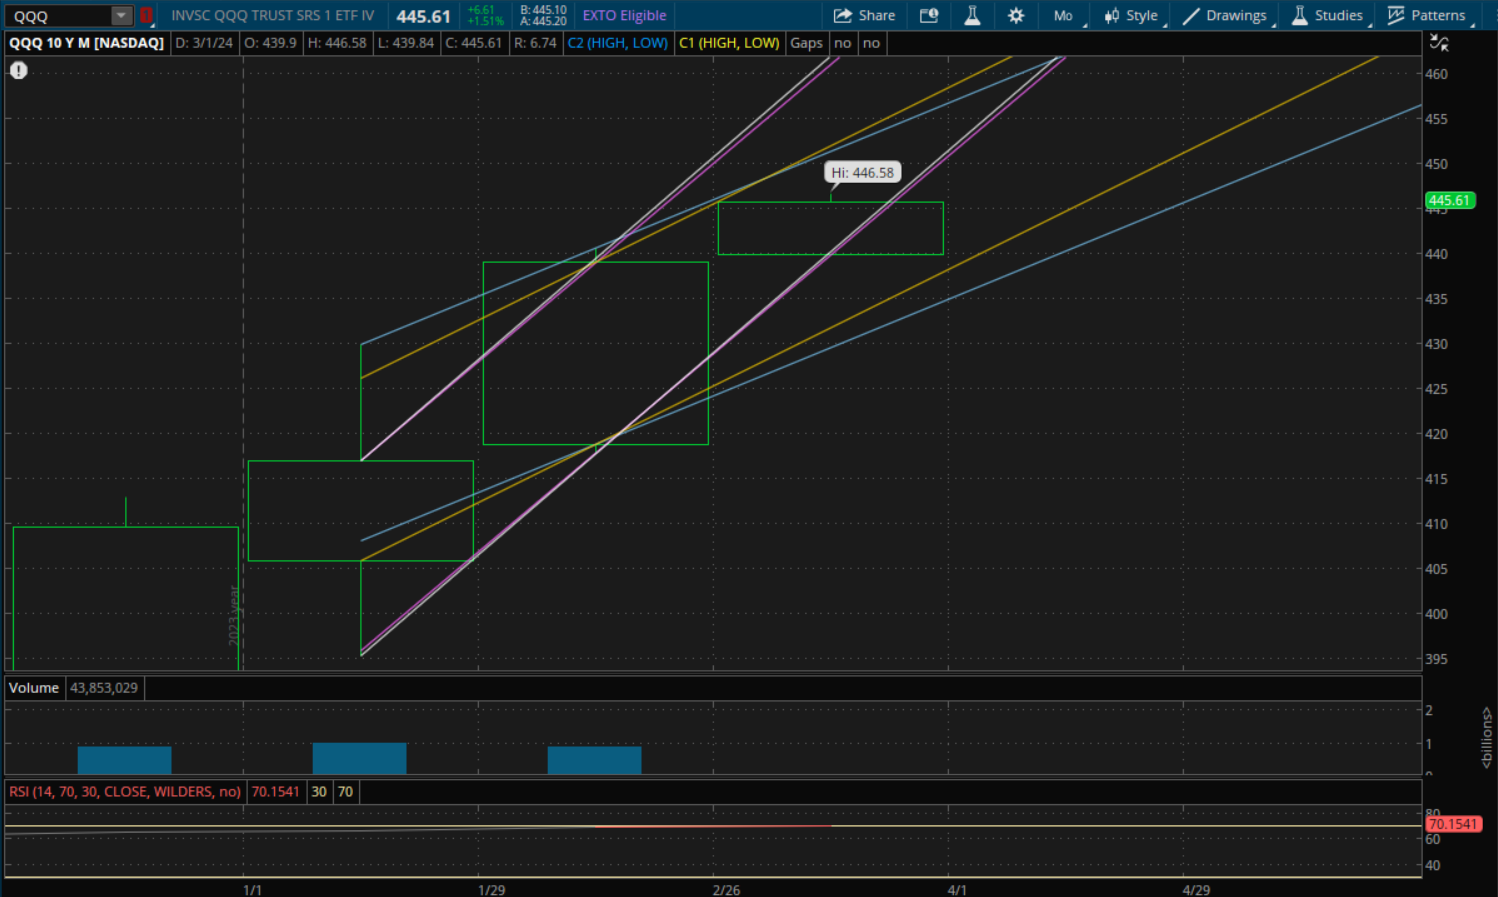
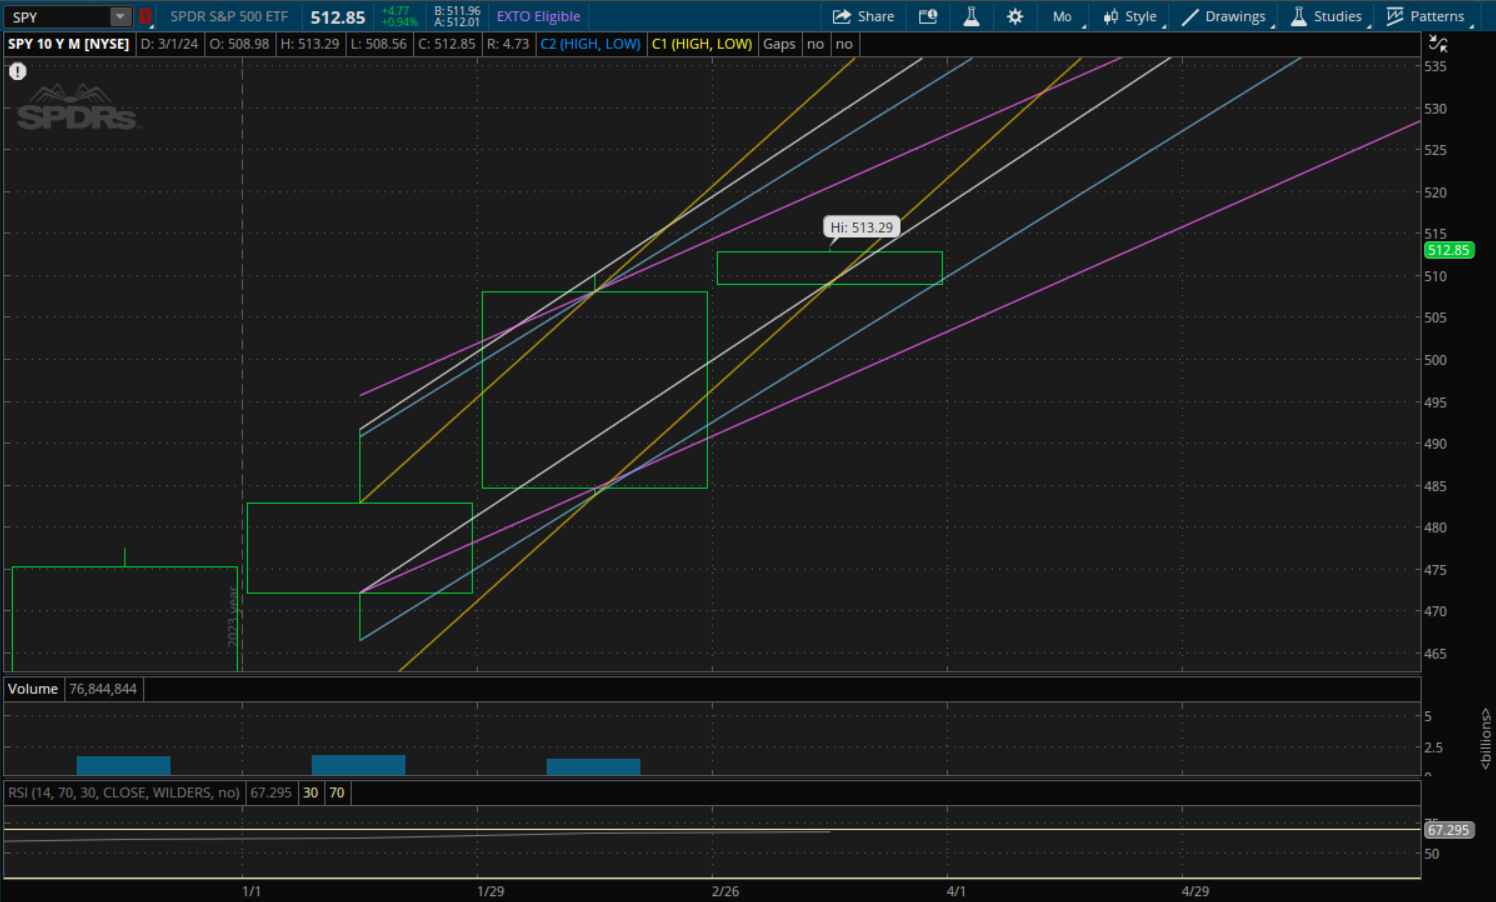
Looking at technicals now, SPY, QQQ and IWM have already broken through the February highs. SPY opened above, re-tested and held monthly uptrend support on Friday which is at about $508.50. So for now the bulls remain in control as long as that $508.50 support holds. The next monthly resistances to watch will be at about $516.50, $520.50-$520.75, $522.50-$523, $525.25-$525.50, $526-$526.50, $527.25-$527.50, $528.50-$529 and $533-$533.50. If SPY breaks through $508.50 support, the next supports to watch will be at $503-$503.50, $502-$502.50, $501-$501.50 and $497-$497.50.
For QQQ, it also opened above monthly uptrend support, re-tested and held it last week and it broke through the February highs. The next resistances to watch will be at $451-$452, $453.50, $455.50-$456, $461-$462, $463. The first support to watch will be at $439-$439.50 which it opened above and held to start the month. If that breaks, then the next levels to watch will be at $431.50-$432, $429.50-$430, $428.50, $427-$427.50, $417.81 (last month’s low) and then $416.50-$417.