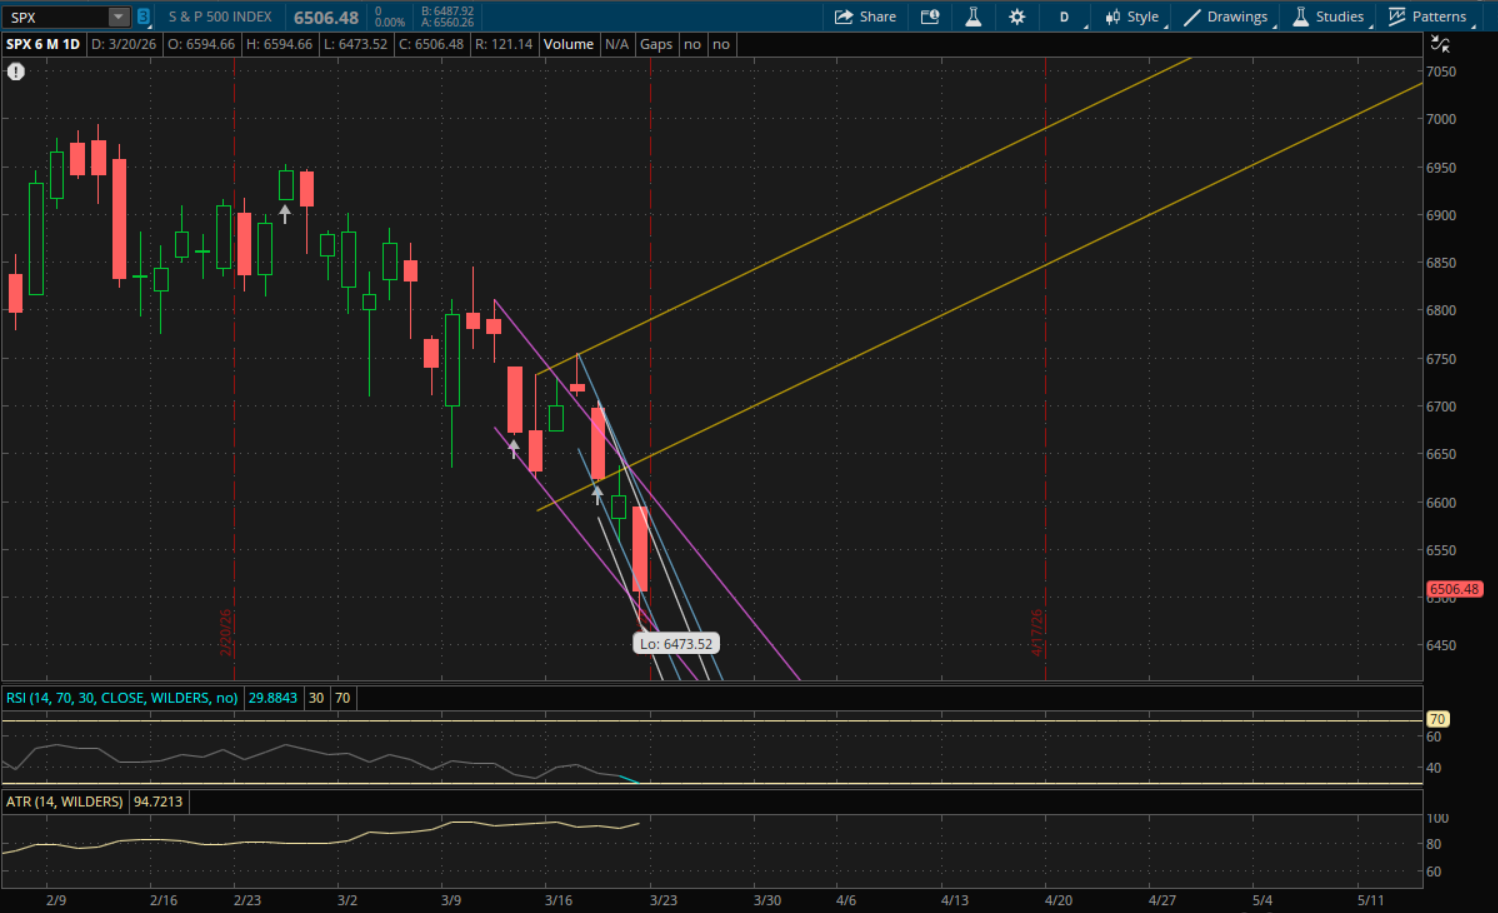
The markets sold off again on Friday with the Russell 2000 posting the biggest loss of 2.26%. The Nasdaq closed down 2.01% and the S&P fell another 1.51% and has now reached oversold territory on daily time frames as RSI has fallen below 30. This is the most oversold it has been since April 4th, 2025, which was near the bottom of last year's tariff sell-off.
After the market closed yesterday, President Trump posted on Truth Social that they were considering winding down their efforts in the Middle East. This sent markets higher after hours by nearly 1%. With this news and the current oversold conditions in the market it may set markets up for a bounce into early next week - even if it's short lived.
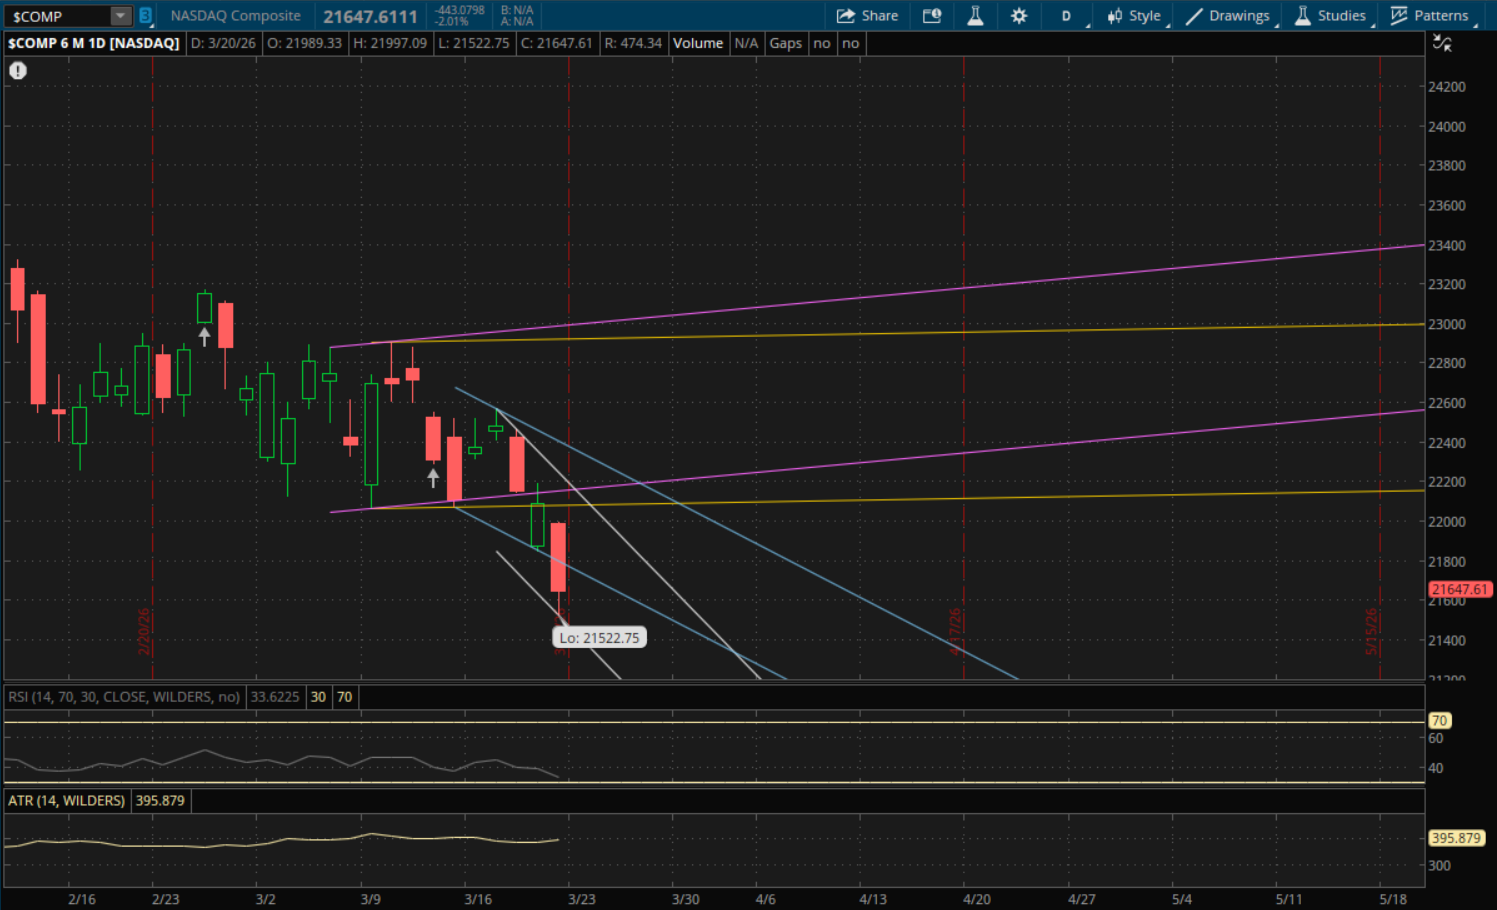
The Nasdaq failed to hold its new downtrend support mentioned in the last update. It broke and closed below it which starts a new downtrend for it as it made another lower low yesterday. Support from its new primary downtrend (white) will be at about 21,410. For now this is the only support to watch as there are no more trends below, and if it breaks through it we'll have to wait to see where it closes for the next trend.
On a bounce, the first resistance level to watch will be from its primary downtrend (blue) at 21,740. With the headlines that came out after the markets closed yesterday, it is possible that we get a gap above this 21,740 level in which case it would be support on a pullback and retest. From there, the next resistance would be at 22,080 from its prior sideways range (yellow) followed by its new primary downtrend (white) at 22,135. If it breaks through its primary downtrend then it will start a new trend and we'll need to see how it finishes. But there would be more resistance at 22,160 from its prior uptrend (purple). Finally its last resistance would be from its prior downtrend again (blue) at 22,350.
The S&P also broke and closed below its prior downtrend, starting a new downtrend for it. The next supports to watch if we get another sell-off will be at 6,460 from both of its prior downtrends (purple and blue) with its new primary downtrend (white) being the last daily support at about 6,417. If Friday's after hours move holds and we get a gap up on Monday, then the next resistance to watch will be at 6,538 from its new primary downtrend (white) which it could potentially gap above. After that its next resistance will be from its prior downtrend (blue) at 6,556 followed by its next downtrend (purple) at 6,592. If it can clear through all of these then its last resistance will be from its prior uptrend (yellow) at 6,652 if we get that snap-back rally.
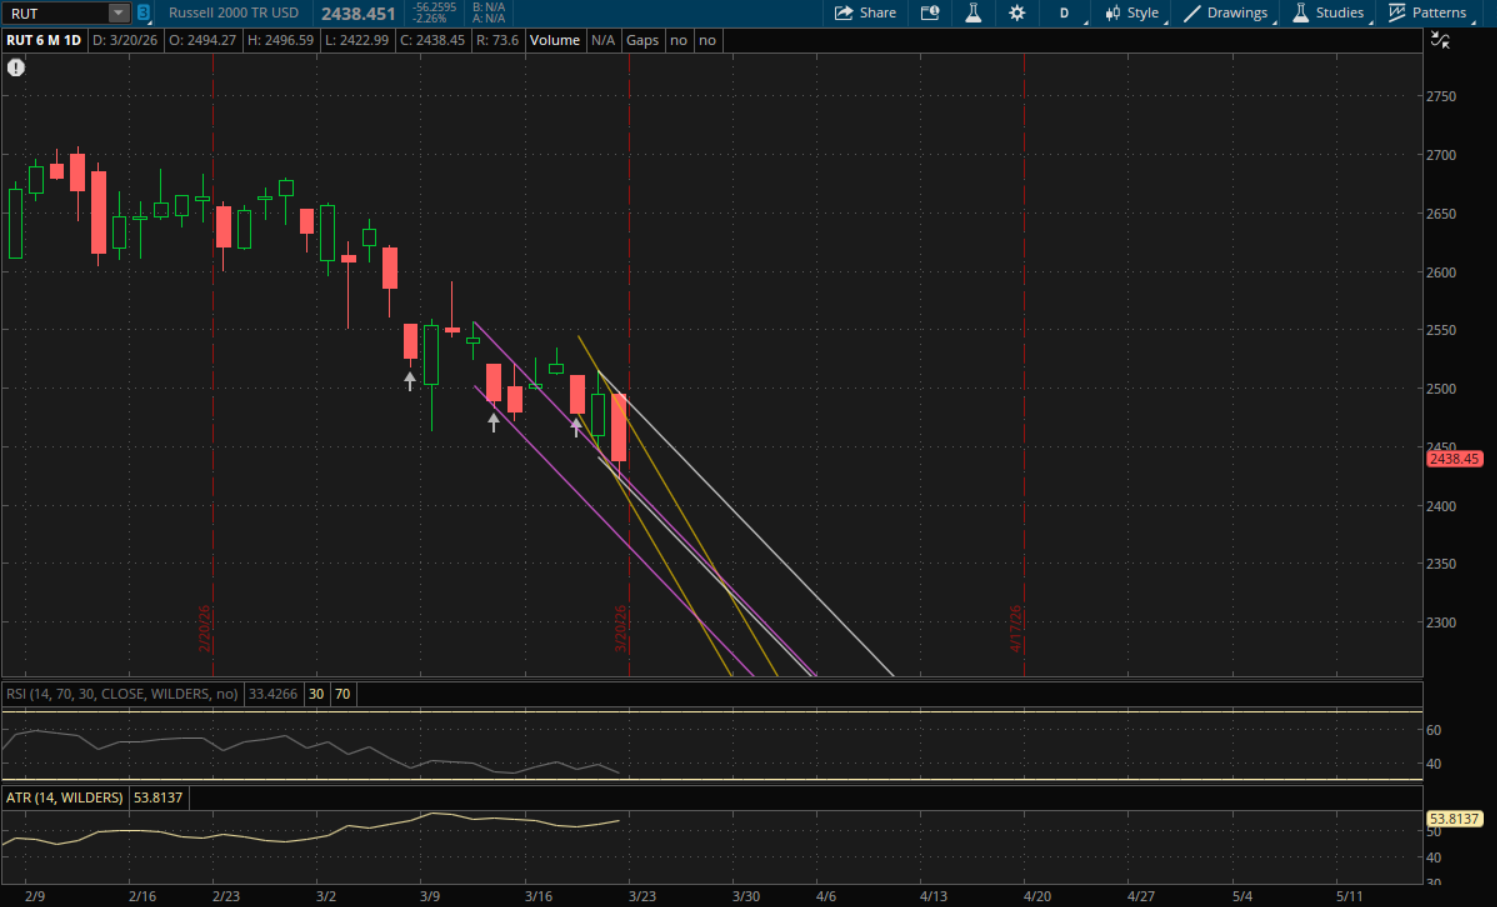
The Russell 2000 actually opened above its prior downtrend, but quickly broke below it and closed well below it. This was a failed breakout for it which also starts a new downtrend. The first resistance to watch will be from the retest of that failed breakout (yellow) at 2,453 which it could gap above on Monday. If it does, that level will act as support on a retest. Its next and last daily resistance would be from its new primary downtrend (white) at 2,477. If it breaks or even potentially gaps above this level as well then we'll have to see how it closes for the next trend.
If we do get another sell-off then the next support to watch will be at 2,409 from its prior downtrend (purple) followed by its new primary downtrend (white) at 2,405. If that doesn't hold, then it will start a new trend, but there will also be more support from its prior downtrend (yellow) at 2,385.