The Russell 2000 fell another 1.7% this week and is now closed down over 10% from its all time highs set in January, officially putting it in correction territory. The Nasdaq however was the worst performing for the week as it closed down 2.1% and is just shy of reaching that correction territory. Meanwhile the S&P lost another 1.9%. Despite another week of selling, the VIX finished the weak lower by 1.5%. It has not breached its March 9th high of $35.30 even thought the S&P is down another 4% since then. While this may seem like a bottom signal, it can be very misleading as the VIX and markets don't always have inverse correlations. For example, in 2022 the VIX peaked in January while the markets continued to move lower for 9 months during that bear market. The VIX never made a new high above its January highs which was just the start of the bear market. So even though we may be able to gain insights from the action in the VIX, it's best to take it with a grain of salt.
There isn't any big economic data next week so the markets will continue to be focused on the Middle East. The Fed had its rate decision this past Wednesday and they left rates unchanged as expected. But, as I've been mentioning in recent updates, the odds of future rate cuts have shifted dramatically. Prior to the war and the spike in oil prices, the market was pricing in a cut for the June 17th (2026) meeting with no chances of a rate hike. Now the market is pricing in no cuts through July of 2027 and odds of rate hikes have been increasing.
As I mentioned in the last daily update, yesterday after the market closed President Trump posted on Truth Social that they were considering winding down their efforts in the Middle East. This sets markets up for a potential gap up on Monday which would be a little more constructive for markets especially if it's a big gap up above prior weekly supports.
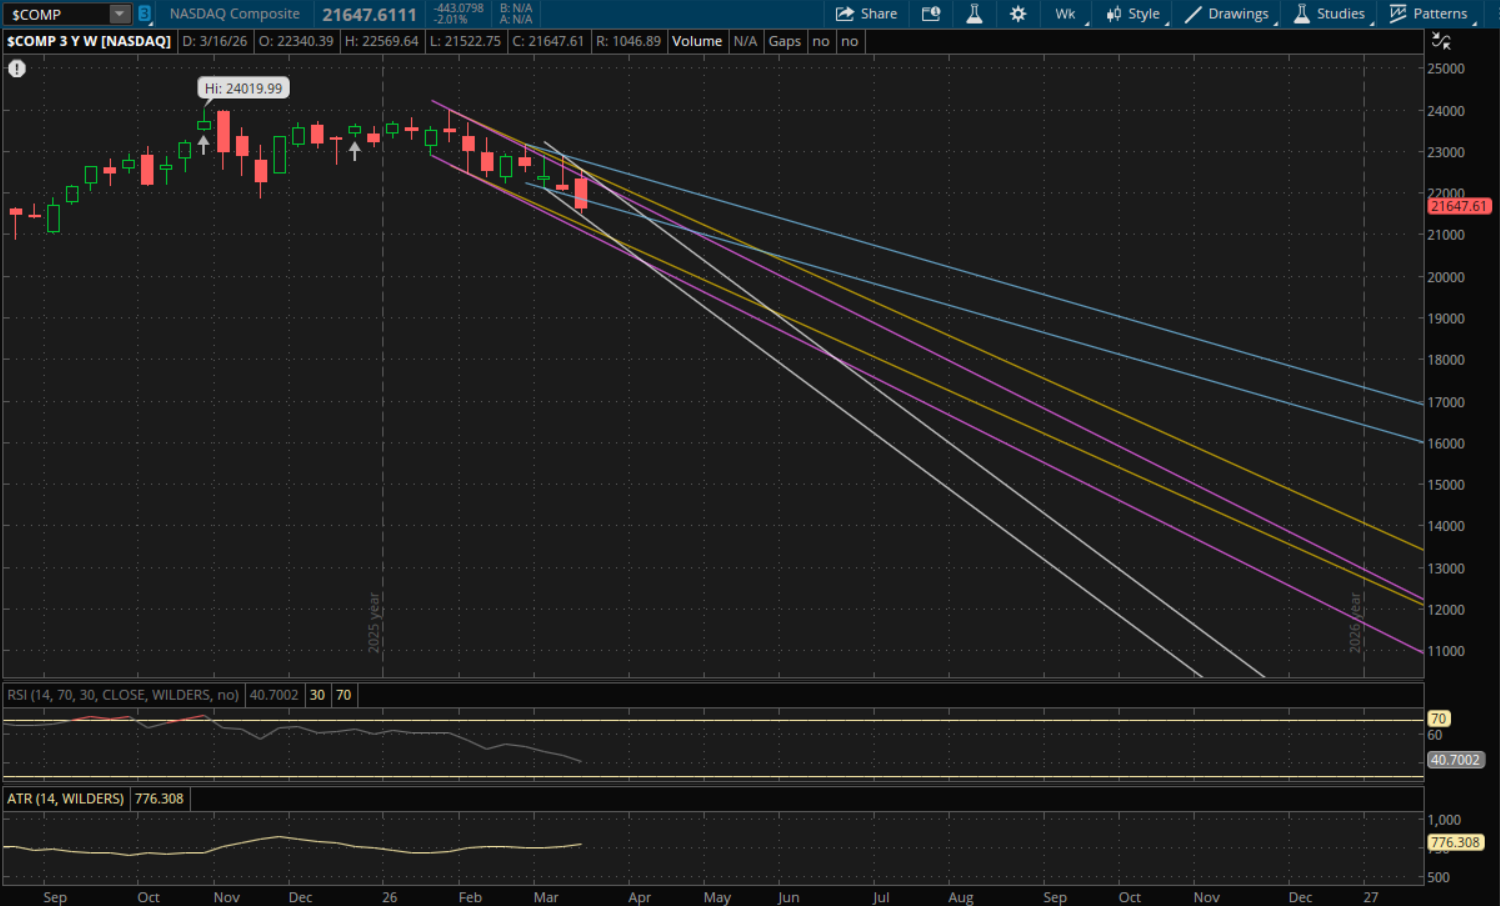
For the Nasdaq, it broke and closed below its prior weekly downtrend support which started a new downtrend for it. The first key level to watch for next week will be from its prior downtrend (blue) that it closed below this week which will be at 21,735 for next week. This is about 0.4% away from where it finished on Friday, so it's likely we could open back above it. If that happens, the 21,735 area will be support on a pullback and retest. From there, the next resistance to watch will be from its prior downtrend (purple) at 22,160 followed by its new primary downtrend (white) at 22,225. If it breaks through this new primary downtrend it will start a new trend, but we'll need to see how it closes next week. The last two attempts have led to failed breakouts. There would also be more resistance from its next downtrends (yellow) at 22,350 and its last downtrend (blue) at 22,650.
In the event we continue to sell-off then the next support will be from its primary downtrend (white) at 22,100. If that doesn't hold again, it will start a new trend and we'll need to see how it closes the week out. But its prior downtrends would also be support underneath that at 21,020 (yellow) and then 20,875 (purple).
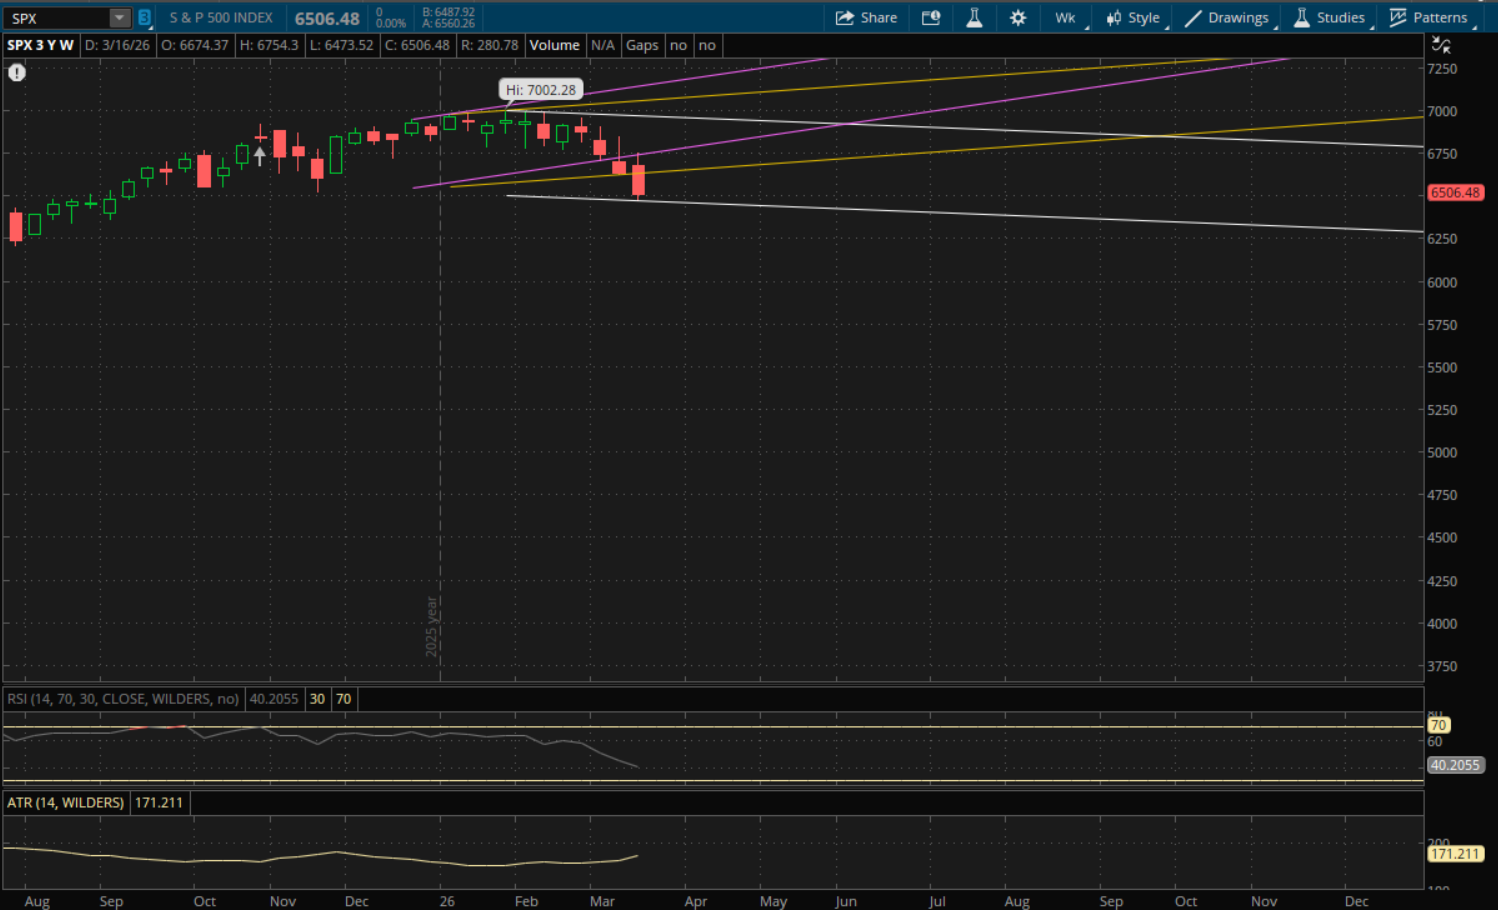
The S&P broke below and closed its last weekly uptrend support and now starts its first weekly downtrend. However, it's already at the bottom of this new range (white) and there is room to bounce here, especially given the after hours activity on Friday. The problem is that its prior uptrends will now be resistance on any bounce attempts, so it's not out of the woods yet.
For now, its new primary downtrend (white) is the only support level to watch and that will be at 6,465-6,470 next week which is just below this week's low of 6,473.52. If we do get a rally going, the first big resistance will be from its last uptrend (yellow) at about 6,640. If it can break through this level, then its prior uptrend (purple) will be the next big level at 6,760 which is just above this week's high of 6,754.30.
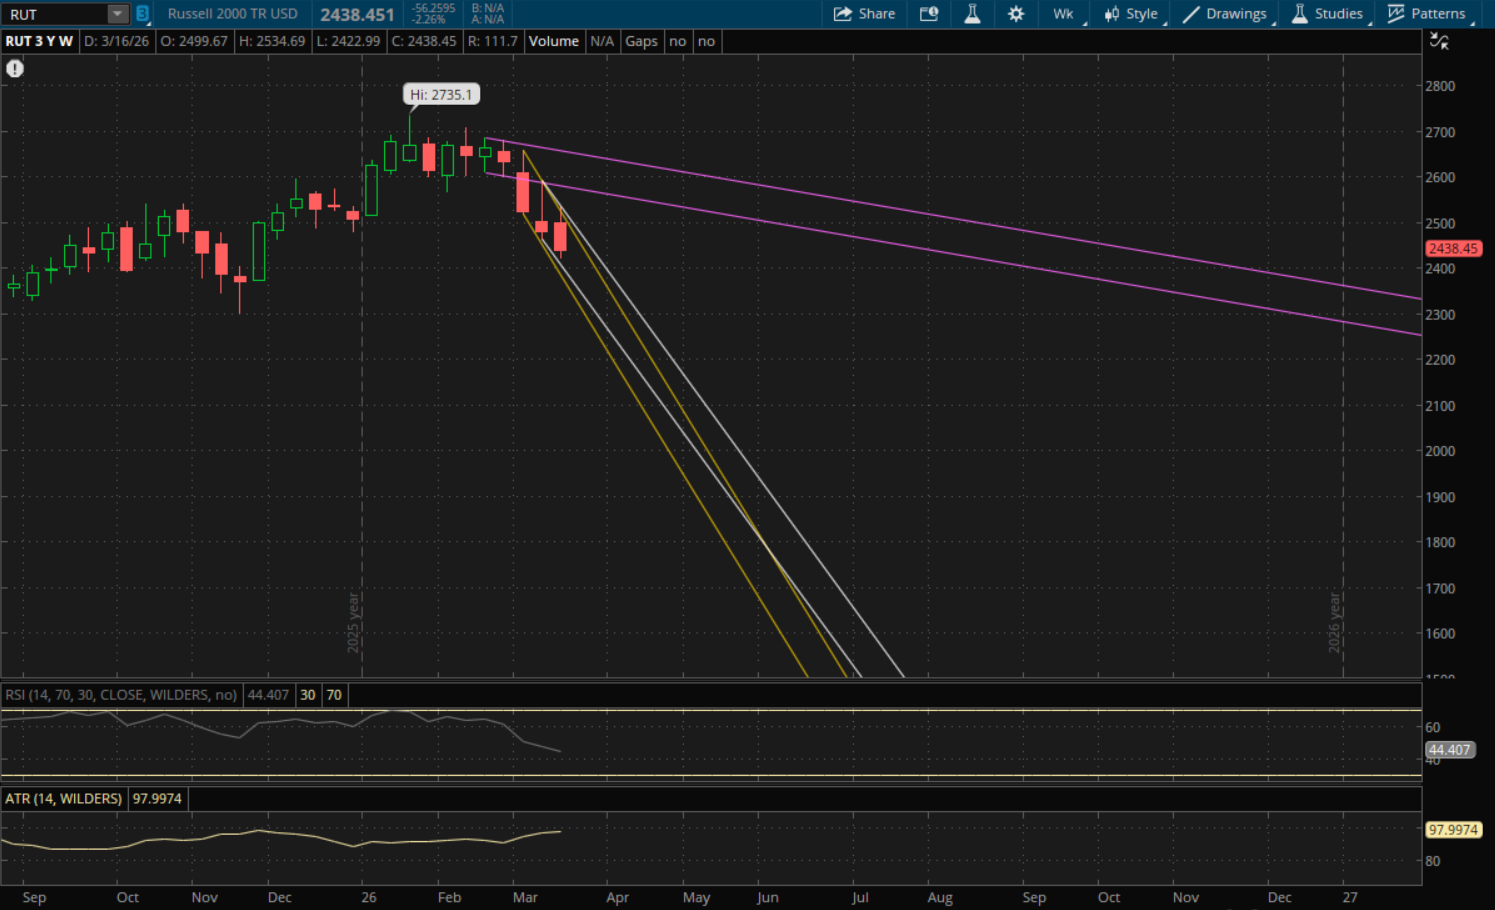
The Russell 2000 had a failed weekly breakout this week as it broke above its prior downtrend and closed well below it. This starts a new weekly downtrend for it as well. The first resistance to watch will now be at about 2,457 from the retest of this week's failed breakout (yellow) followed by its new primary downtrend (white) at 2,478. It's possible we get a gap up above the retest resistance as 2,457 is about 0.8% away from where it closed this week. It's unlikely it gaps above its new downtrend as that is about 1.6% away, but it's still possible. If it does gap above either of those, then they will act as supports on a pullback.
On the other hand, if the sell-off continues then the next support to watch will be from its primary downtrend (white) at 2,349. If this does not hold it will start a new trend but we'll need to see how it finishes the week to determine the levels for it. There would be more support below its primary downtrend from its prior downtrend (yellow) at 2,315 and this would be the last weekly support for it.