In last week's update I noted that despite the weak finish near the lows for markets the action was actually constructive and that markets were setting up for a relief rally this week as long as they did not gap down on Monday. They ended up gapping higher on Monday, even though that gap up faded, the gap up above weekly supports was what mattered. There are a lot of different reasons people are throwing out there for the rally, but in my opinion it is all technical. Tech led the markets higher this week with the Nasdaq gaining 4.4%. The S&P and Russell 2000 both posted weekly gains of 3.3% and the S&P broke its 5 week losing streak. With the bounce back in markets, the VIX closed down 23% on the week to finish at $23.87.
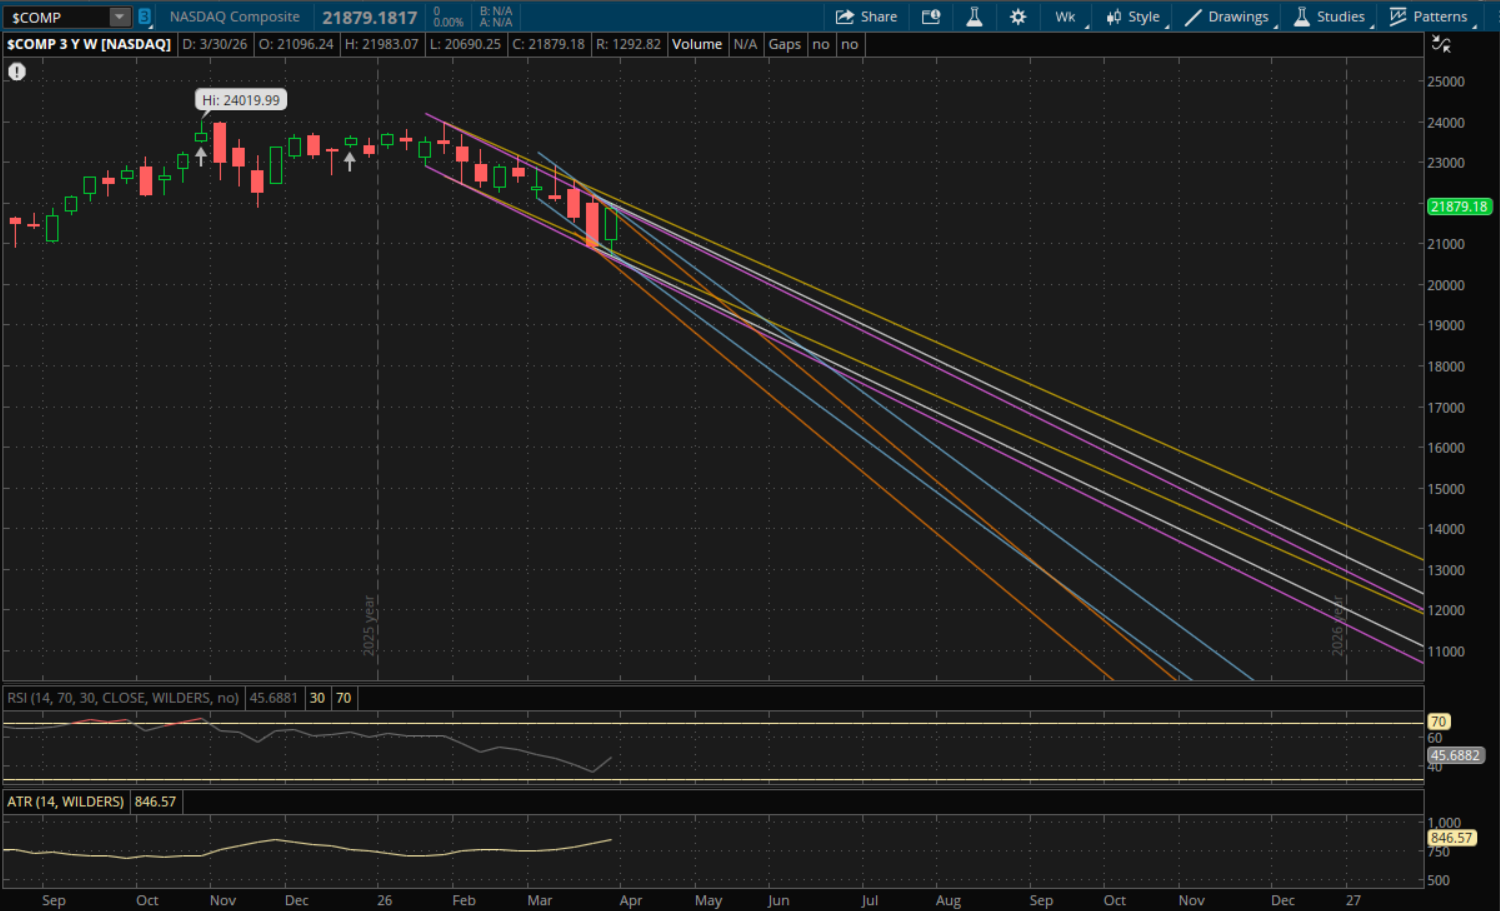
So now the question is whether this was just a relief rally or a real market bottom. Larger time frames (monthly and quarterly) remain bearish for now but this week's price action was constructive and there is likely some more upside for this rally. Just like last week, where we open on Monday is going to be very important. If it's a gap down, at least for the Nasdaq, it becomes more difficult for the bulls to continue this rally because all of its prior downtrends will be resistance again. The first key level to watch for the Nasdaq will be at 21,760 which is going to be support/resistance from its new primary downtrend. The Nasdaq finished at 21,879 yesterday, so it would have to gap down about 0.5% to get back below this level. Odds are it opens above it in which case it will act as support on a pullback and the next resistance to watch would be from its prior downtrend (yellow) at 21,940. It could potentially gap above this level as well which would be even more constructive as this area would then act as support as well. For now, that is the only resistance level to watch in the event that it opens above its primary downtrend (white) on Monday.
Its prior downtrends will also be support on a pullback at 21,700 (purple), 21,550 (blue), and 21,425 (orange). This is assuming it opens above them on Monday. If it gaps back below any of them, then they become resistance. If we were to have another big sell-off again, then the next big support to watch below its orange downtrend would be at about 20,620 from the bottom end of its next downtrend (yellow).
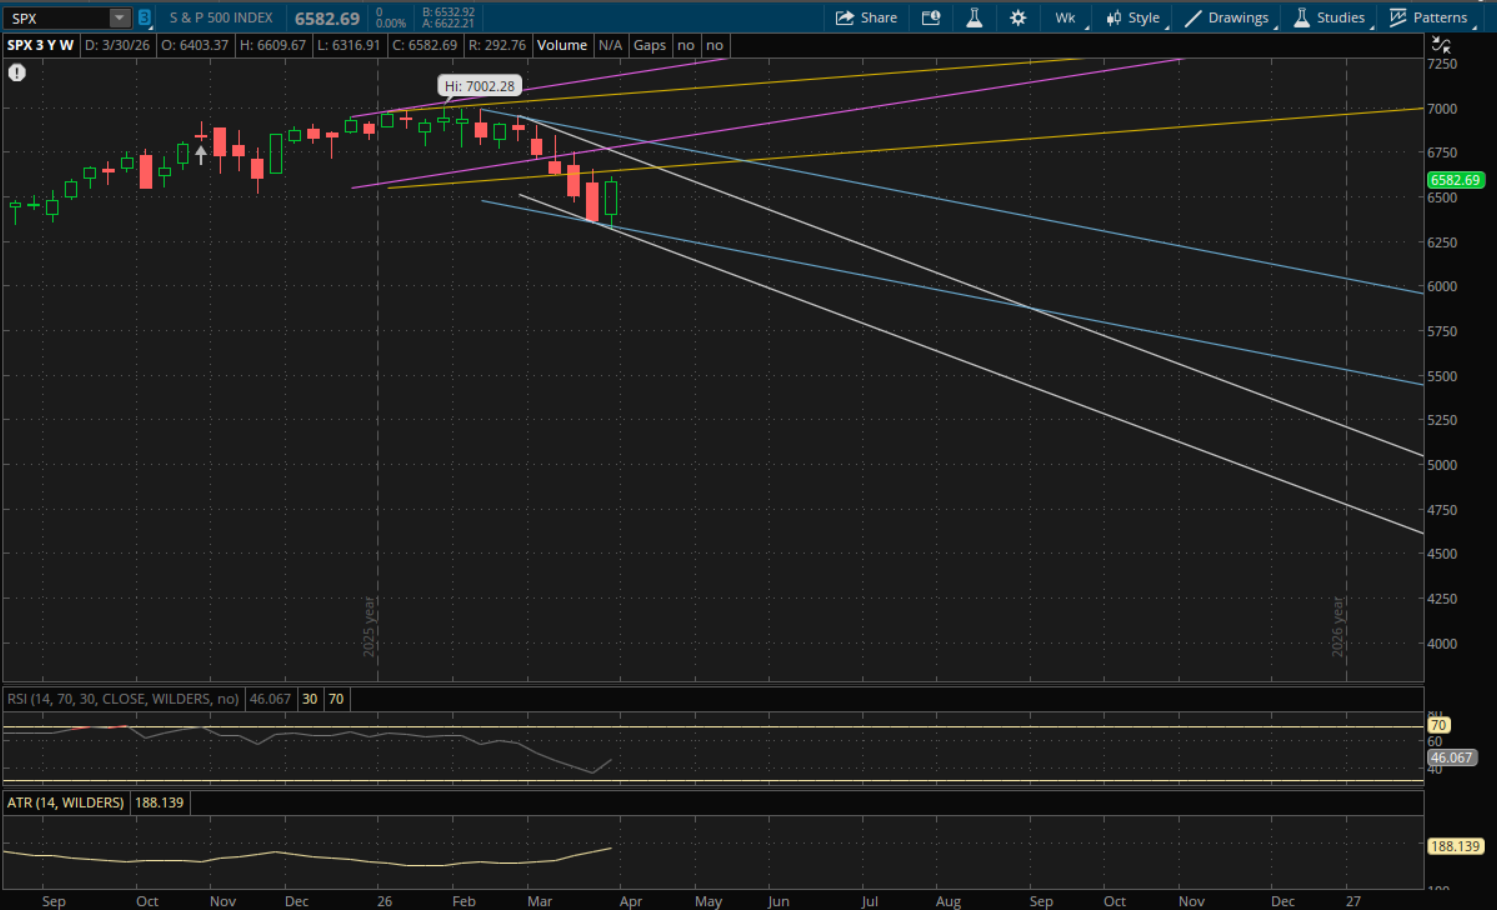
The S&P had a failed breakdown this week, but since it did put in a lower low, it still starts a new downtrend. Its first resistance to watch on a continued rally is going to be from its prior uptrend (yellow) at 6,655. After that is new, primary downtrend (white), will be resistance at 6,715-6,720. This would be another 2% away from current levels. If it can break through its primary downtrend resistance, there would be more at about 6,793 from its prior uptrend (purple) and then 6,830 from its prior downtrend (blue).
On the other hand, if the sell-off resumes the first support to watch will be at about 6,315-6,316 from its prior downtrend (blue) which would be the retest of this week's failed breakdown and this week's low which was 6,316.91. If it fails to hold this retest, then its new primary downtrend would be support at 6,275.
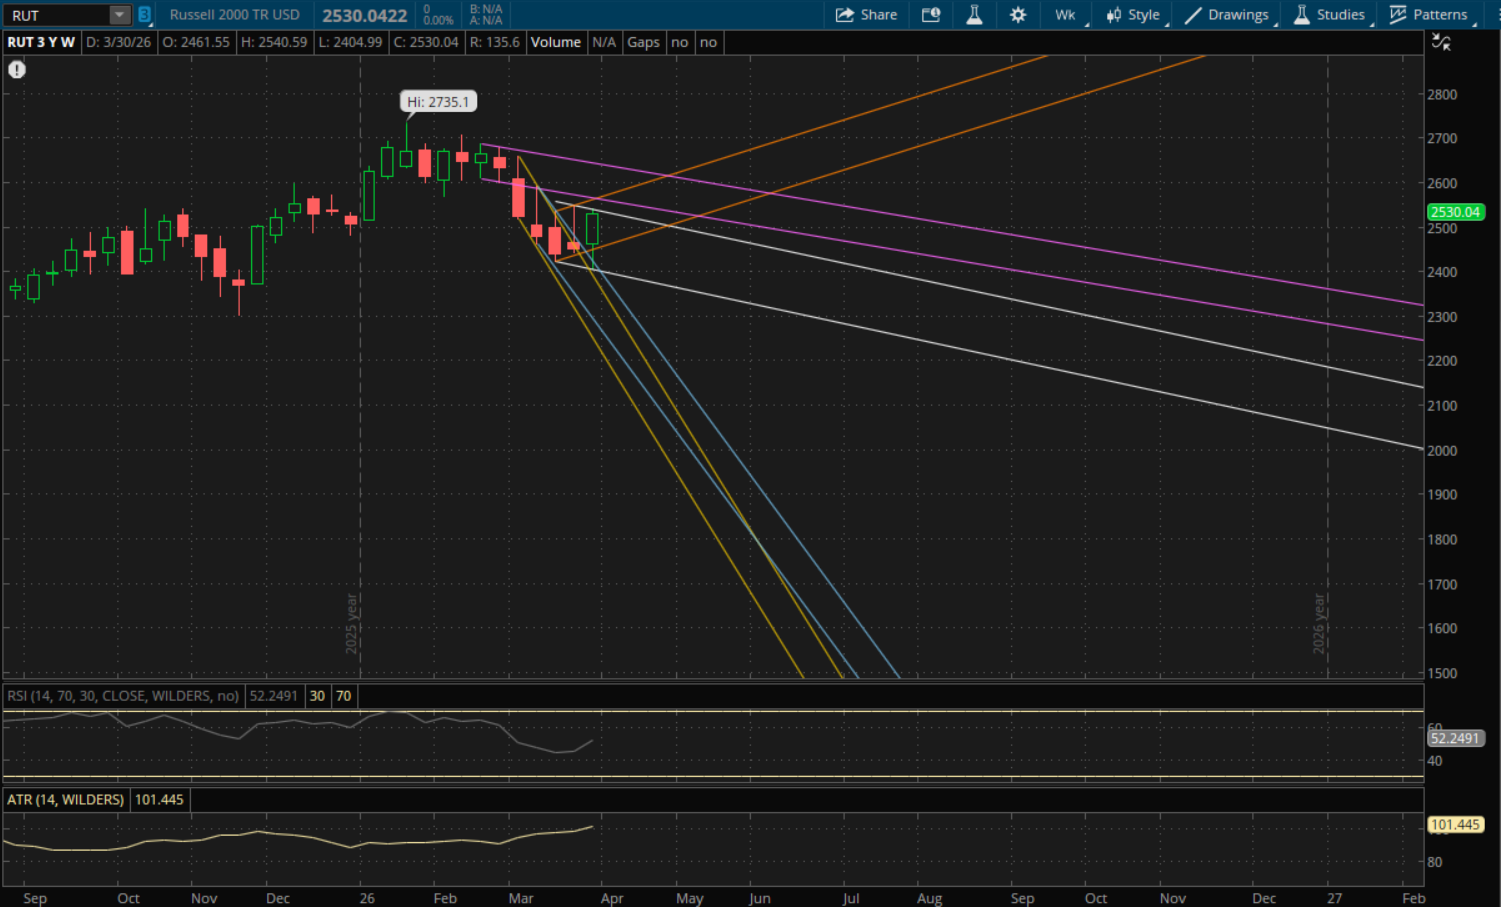
In last weekend's update I mentioned that the Russell 2000 had a failed breakout but that it started a new uptrend which was one of the reasons I was constructive going into this week and was looking for that relief rally. It did open above this support on Monday, but it broke through it and made a new lows. Now it did rally back to close above it which now gives it a failed breakdown like the S&P. However, it's still a new downtrend as it made that lower low. Resistance from its new primary downtrend (white) will be at 2,531-2,532 which is essentially where it closed this week out at (2,530). So its a toss up for whether or not it opens above its primary downtrend on Monday. If it opens above 2,532 then that level becomes support and the next resistance to watch will be at its prior downtrend (purple) at 2,557-2,558. After that, its next uptrend (orange) will be resistance at 2,575 and then the last resistance would again be from its purple downtrend (top end of the range) at 2,636.
If the Russell fails to open above its primary downtrend resistance at 2,531-2,532 on Monday then that will be the first resistance level to watch. On a pullback the first support will be at 2,463 (orange) and then its new primary downtrend (white) will be in play again from the bottom end of the range at 2,397. If that does not hold, then its prior downtrend (blue) would be next at 2,365.