The market rally continued this week which was led by tech which gained 6.8% for the week. Small caps were also very strong as the Russell 2000 closed up 5.6% and hit new all time highs on Friday. The S&P gained 4.5% for the week and it was the 3rd consecutive week of +3% gains which has only happened two other times since 1950. Friday's big rally was sparked by news of Iran opening the Strait of Hormuz due to the Israel-Lebanon ceasefire. However, over the weekend there was news that Iran had closed it again after they claimed that President Trump was making false claims over negotiations which could throw a wet blanket on the current market rally.
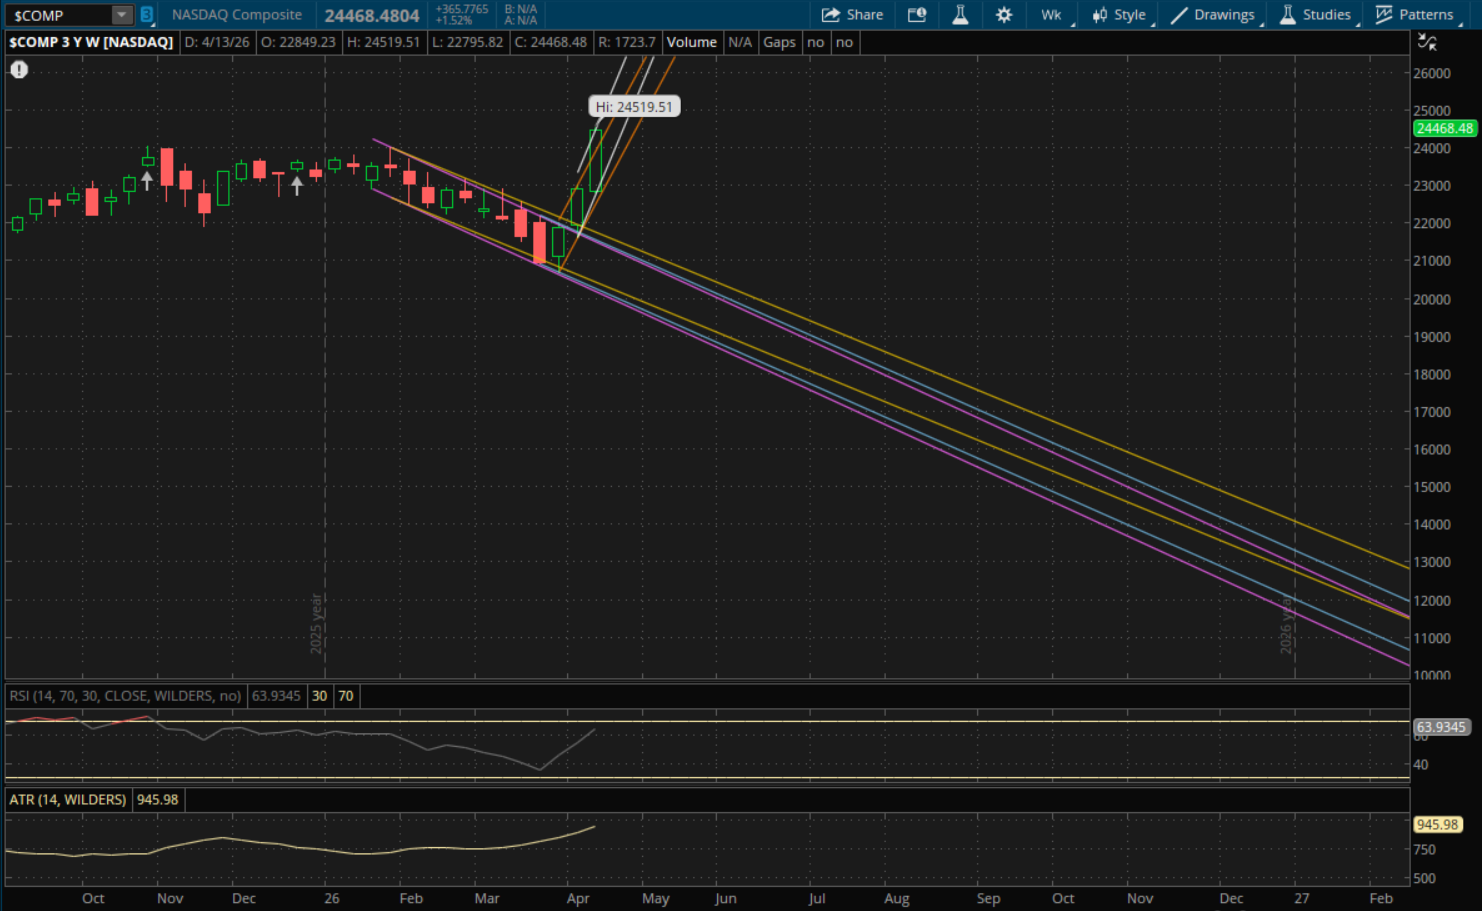
From a technical perspective it wouldn't be surprising to see a pullback after this massive rally that we've had over the last few weeks. In my update last weekend I noted that the markets had started new weekly uptrends and that the rally was likely to continue. With the strong rally we got, the Nasdaq broke and closed above last week's primary uptrend. This starts a new primary uptrend (white). However the first level to watch for this week will be from last week's trend (now orange) at about 24,875. This is about 1.7% away from Friday's close of 24,468, so it's very unlikely that we gap above it on Monday. Odds are it opens below this 24,875 level and that level will be resistance on a rally attempt. If it does gap above it or break through it, then its last weekly resistance to watch will be from its new primary uptrend (white) at 25,700-25,725.
On a pullback, the first support to watch will be from its primary uptrend (white) which will be right around 24,000. I think it's very likely that this area gets tested this week which would only be about a 2% pullback and it would be a good reset for the markets after the huge rally we've seen over the past few weeks. If the 24,000 area doesn't hold then its next support will be at about 23,500 from its prior uptrend (orange). There are other supports below that, but they're far away with the next one at about 21,500 (yellow).
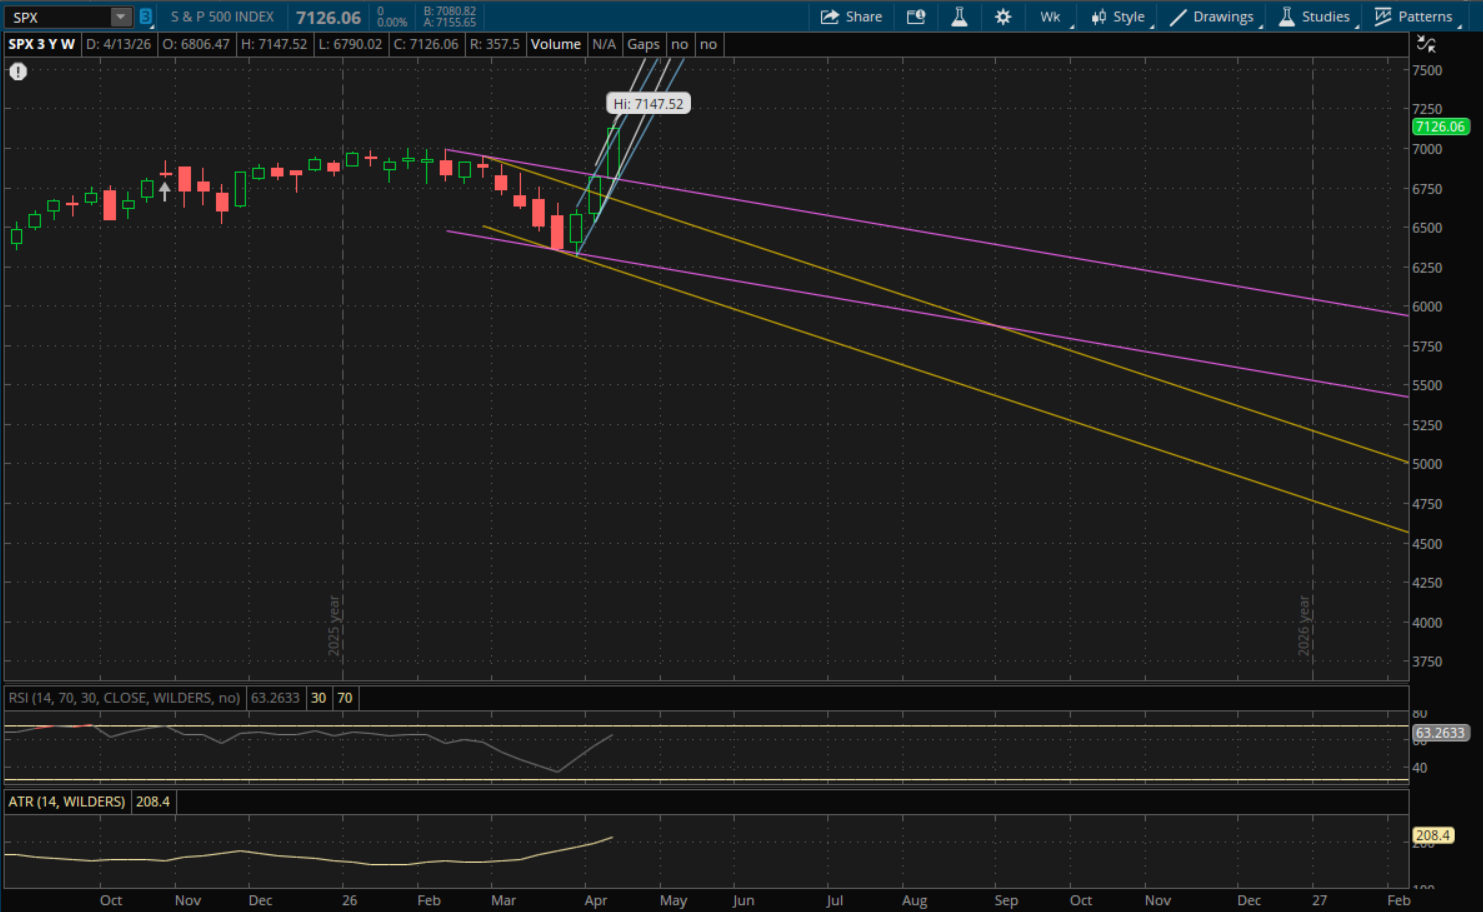
The S&P is in the same boat here as it closed above last week's primary uptrend which starts a new uptrend for it. However, it's extremely unlikely that it gaps above above last week's trend (blue) which will be at about 7,280-7,285. This level is 2.2% away so it will almost certainly be resistance next week rather than support. It could still potentially break through it during the week, and if that happens the last resistance to watch would be from its new primary uptrend (white) at 7,400-7,410.
On a pullback its new primary uptrend (white) will be the first support to watch at 7,045-7,050 which is a little over 1% away and I think it's very likely we test it. If that doesn't hold, its next support (blue) will be at about 6,975. After that, there would be support at about 6,790 which is last week's low and its next trendline support (purple). There would be additional support from its prior downtrend (yellow) at 6,640 but that is very far away and it's unlikely to be tested.
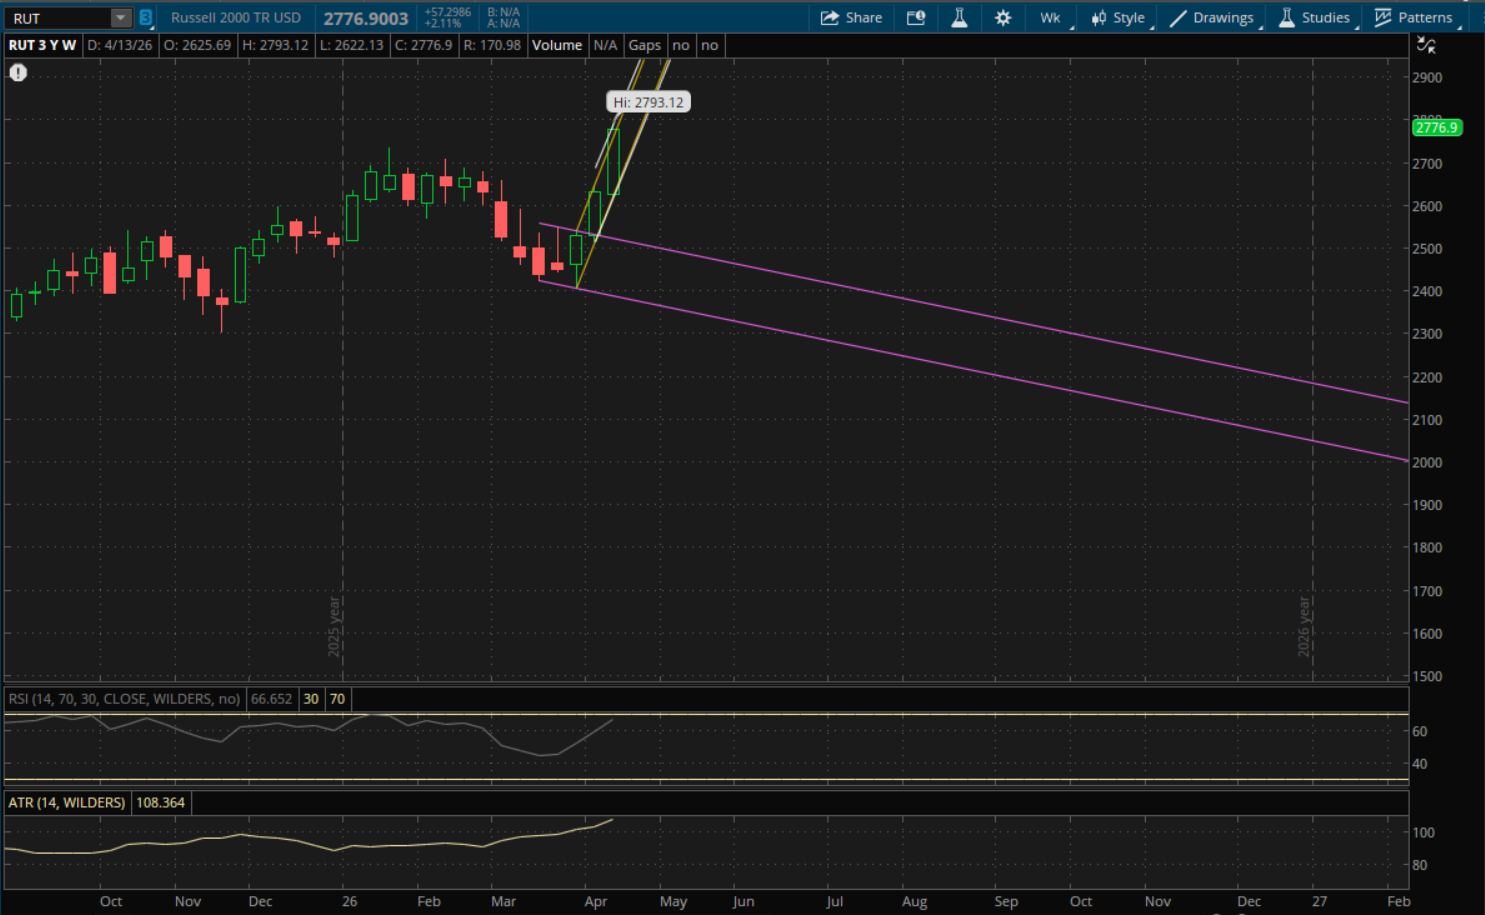
The Russell 2000 closed above its prior uptrend which also gives it a new weekly uptrend going into this week. But, just like with the S&P and Nasdaq it's unlikely that it gaps above last week's uptrend (yellow) which will be at about 2,875 as that is about 3.5% away. Instead, this level will be resistance on a rally attempt. If it does end up breaking through it, then its last weekly resistance will be around 2,900 from its new primary uptrend (white).
On a pullback, its prior uptrend (yellow) will be the first support at about 2,738 and its primary uptrend (white) will be support just below that at 2,725-2,730. If those do not hold, then its next support is pretty far away at about 2,515 (purple).