The market was very volatile today as they gapped up in the morning and the at the highs of the day the Nasdaq was up 1.25%. But the markets sold off sharply in the first hour and at the lows of the day the Nasdaq was down 3.6%. The volatility continued into the close as markets rallied back with the Nasdaq closing down 0.97% - down but well off of the lows of day. Small caps were the best performing as the Russell 2000 closed up 0.41%, which was well off of the highs. And the S&P finished down 0.26% for the day. With today's volatility, the VIX spiked again and hit a high of $23.34 where it was up over 23% for the day. However it settled at $19.87, up just 5% after the end of day recovery for markets. Tomorrow morning we will get the CPI print which is the biggest data point for this week.
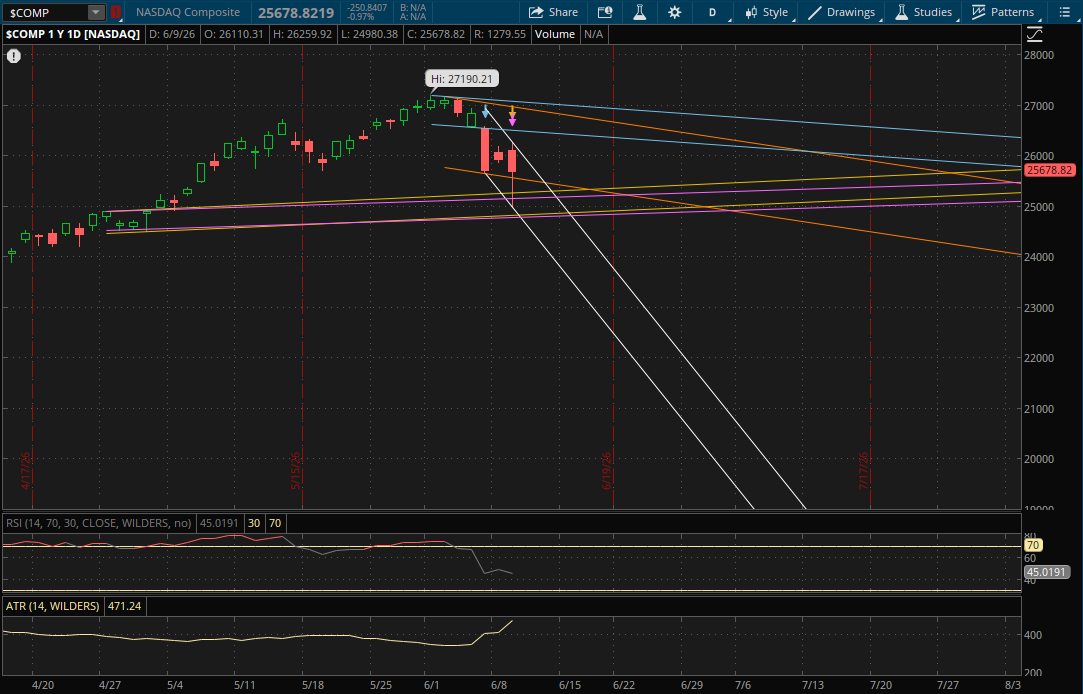
The Nasdaq broke down below its primary downtrend support today but it did rally back and close above it. It wasn't a strong finish, and it did make a lower low, so even though this was a failed breakdown it still starts a new downtrend.
For tomorrow, the first resistance level to watch on the Nasdaq will be from its new primary downtrend (white) at about 25,915-25,925. If it can gap above this level on the CPI print, then it would become support on a pullback. If it does gap above it, or break through it, then the next resistance to watch would be from its prior downtrend (blue) at about 26,480. After that its last resistances would be at 26,925 (orange) and 27,050 (blue - top of the range) in the event of a big rally.
On a continuation of this pullback, the first support to watch will be from its prior downtrend (orange) at about 25,525 which would be the retest of today's failed breakdown. If that doesn't hold, its next support will be from its prior uptrend (yellow) at 25,275 followed by its next uptrend (purple) at 25,165. This is from the top of those prior ranges. If those don't hold, they'll also provide support from the bottom of the ranges at 24,830 (yellow) and 24,780 (purple). If neither of those levels hold, then the last daily support will be from its new primary downtrend (white) at 24,625-24,650.
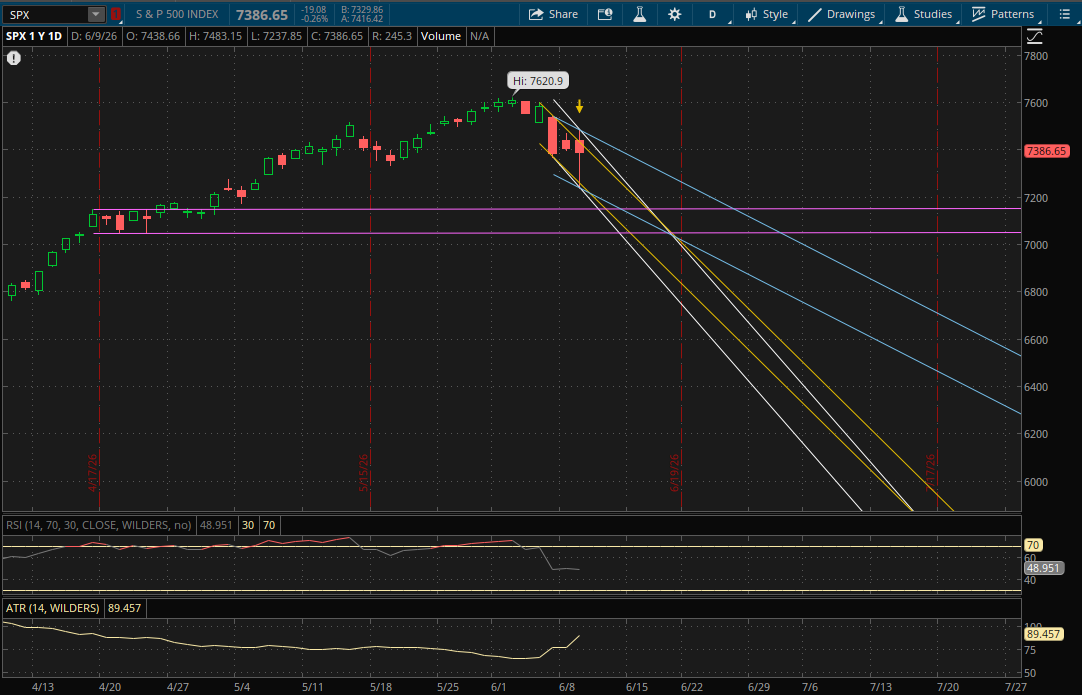
The S&P gapped up this morning above its last primary downtrend, but it failed to close above it. It also broke through the bottom end of the range and closed back above that. So it now starts two new downtrends as it had a failed breakout and breakdown below its prior primary downtrend. Since it did make a lower low both of its new trends are still downtrends.
The first level to watch for tomorrow will be its first new downtrend (white) which will be resistance at about 7,417. If it can gap over this on the CPI data, then that will act as support on a pullback. After that, its next new downtrend (blue) will be resistance at about 7,455. If it breaks through these then it will start a new primary trend but we'll have to wait to see how it closes first.
On another pullback, the first support to watch will be from its prior downtrend (yellow) at about 7,371. If that doesn't hold, its next support levels will be far from the bottom of the ranges mentioned above. The next one will be at 7,208 (blue), 7,200 (yellow), 7,271 (white), and finally 7,150 from its prior sideways range (purple).
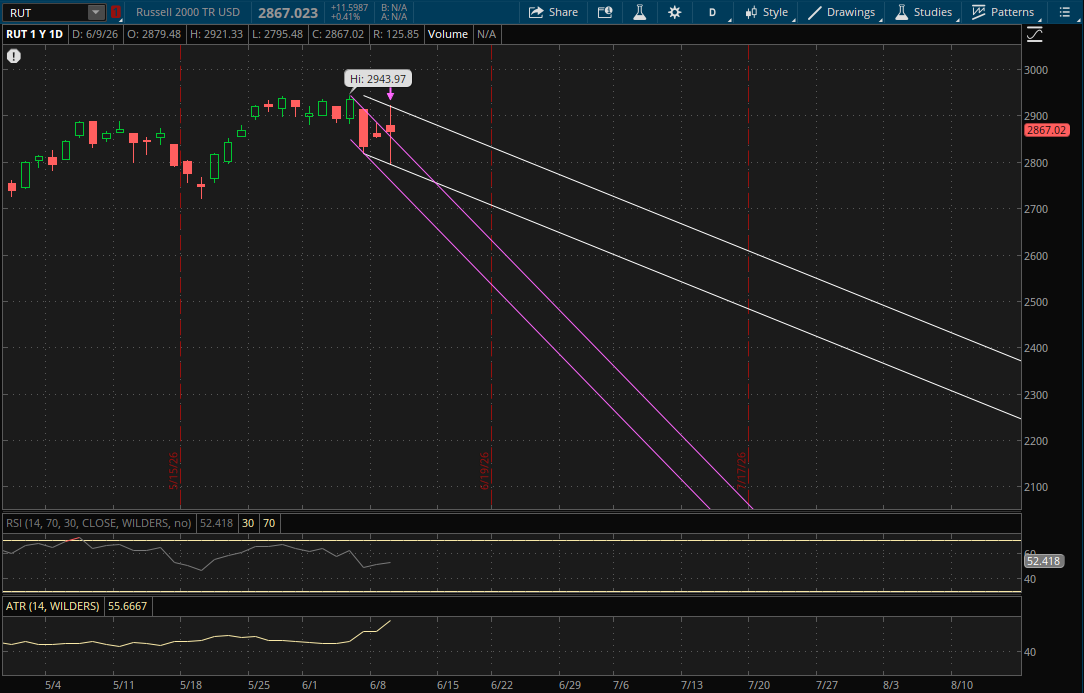
The Russell 2000 broke and closed above its last daily downtrend, but it also made a lower low so it still starts a new downtrend. The new primary downtrend (white) will be the only resistance on another rally attempt at about 2,909 tomorrow. If it gaps above it, this level would become support.
On the other hand if we get another pullback, the first support to watch will be from its prior downtrend (purple) at about 2,823 and if it were to gap below it tomorrow then that level would become resistance. After that, its primary downtrend (white - bottom of the range) would be the next support at about 2,783. Its last daily support would be at 2,728 from the bottom of its prior range (purple).