The markets were weak today on the back of semiconductors which got hit hard again after selling pressure in South Korea's KOSPI overnight spilled over into U.S. markets. The SOXX etf closed down just over 5% for the day while SMH fell nearly 4%. This led to underperformance in tech with the Nasdaq closing down 1.16% while the Nasdaq 100 closed down 1.77%. However there was no rotation this time as the Russell 2000 closed down 0.9% while the S&P lost 0.45%. Selling pressure began broadly in the afternoon after there was a report that the U.S. treasury revoked the general license that authorized sale of Iranian oil with more warnings from the U.S. about Iran's actions in the Strait of Hormuz. This sent oil rallying over 5% which took the rest of the markets lower. With the pullback today, the VIX closed higher by 3.6% to settle at $16.13.
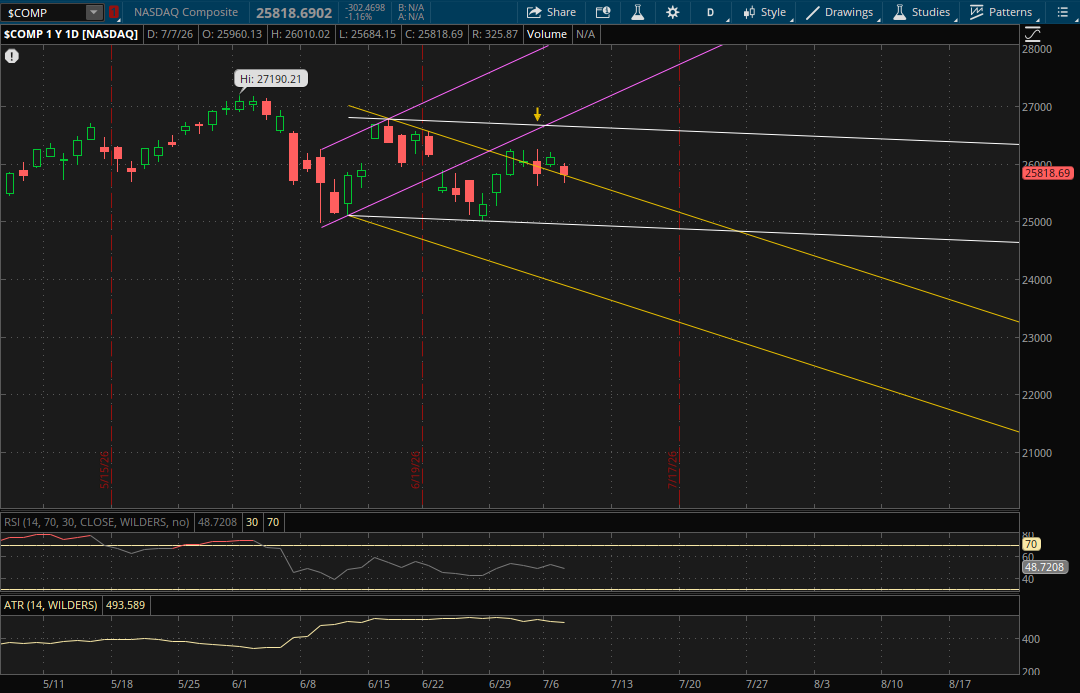
For tomorrow the Nasdaq again doesn't start any new ranges as it remains within its big primary downtrend (white). This will be the only resistance to watch tomorrow on a potential rally at 26,650-26,675. On a pullback, its prior downtrend (yellow) will continue to act as the first support which will now be down around 25,725. If it doesn't hold, the last support to watch will be from its primary downtrend (white - bottom of the range) around 24,950.
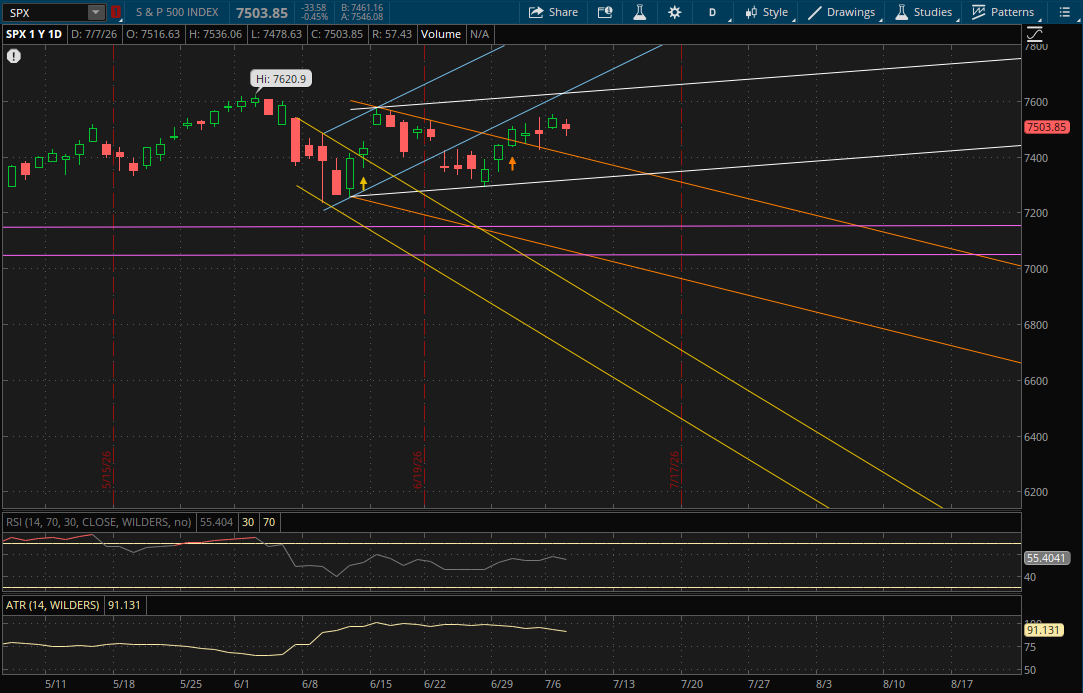
The S&P also continues to trade within its primary uptrend (white) and it will again be the first resistance level to watch at 7,630-7,635 if the rally resumes. After that, its prior uptrend (blue) will be the last resistance at 7,660-7,665. On a pullback, the first support to watch will be from its prior downtrend (orange) at 7,395-7,400 with the last support being from its primary uptrend (white - bottom of the range) at about 7,320.
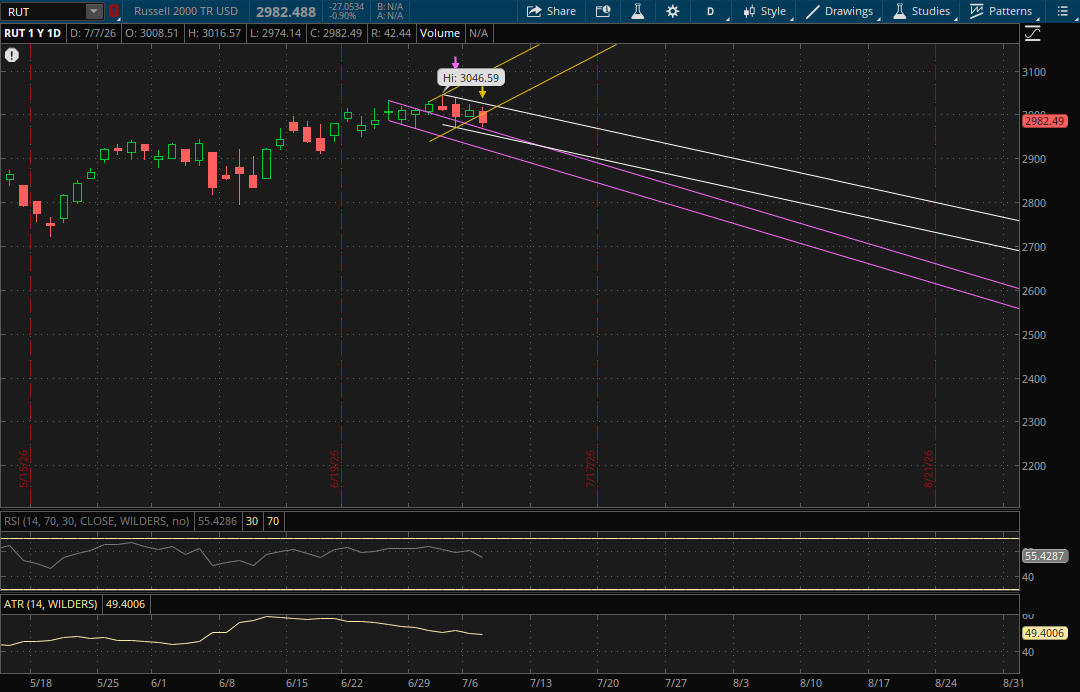
The Russell 2000 looks a bit different here as it broke and closed below its prior primary uptrend today. This now starts a new primary daily downtrend (white) for it going into tomorrow. The only resistance area to watch tomorrow on a bounce back would be at 3,018-3,020 from both its new primary downtrend (white) and its prior uptrend (yellow) where those two trends intersect.
On a continued pullback, the first support to watch will be from its prior downtrend (purple) at 2,959-2,960. If that doesn't hold, its primary downtrend (white - bottom of the range) will be the next support at about 2,950. The last potential daily support would be from its prior downtrend again (purple - bottom of the range) at about 2,915. However, there is also monthly support at 2,965-2,970 (see the monthly update) which it already bounced around to start July.