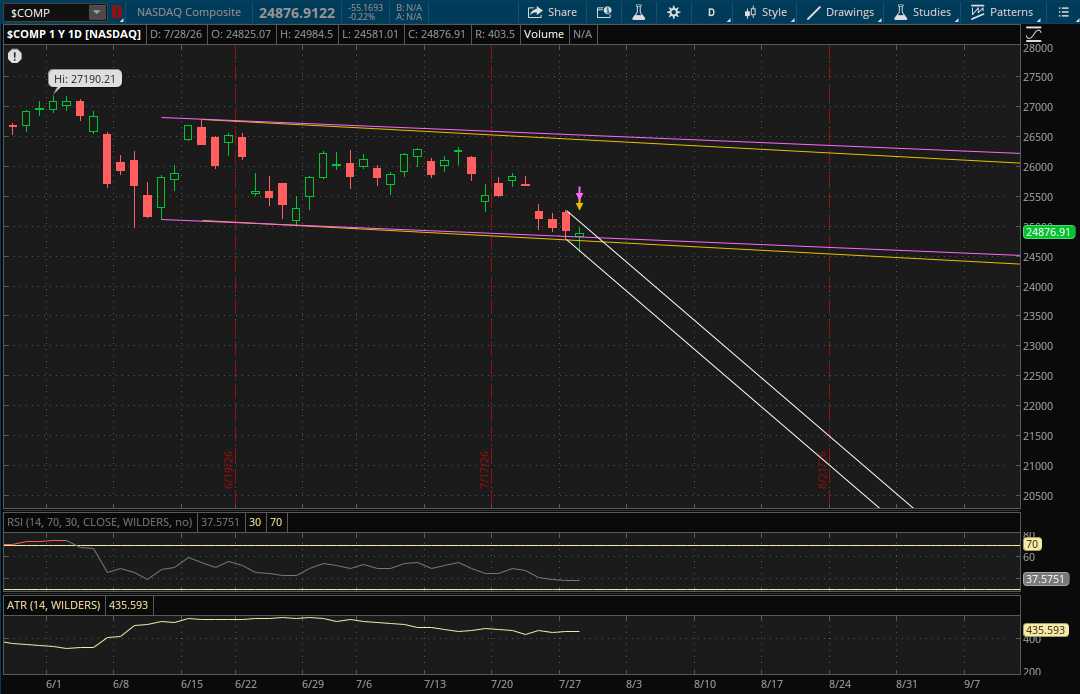
Tech was the laggard again today with the Nasdaq finishing down 0.22% while the S&P and Russell 2000 each gained about 0.20%, and the VIX closed lower by 2.5% for the day. Semiconductors continued their sell-off with SOXX falling another 4.8% and SMH losing 3.45%, but overall it was a relatively muted session ahead of tomorrow's interest rate decision. Currently the odds are in favor of no change in rates with about a 70% probability while a 25bps hike has about a 30% probability. After the close tomorrow, Meta and Microsoft will also be reporting earnings. These are two of the biggest hyper scalers and their capex numbers will also effect semiconductors.
Yesterday the Nasdaq had a failed breakdown but I noted that it was not a strong finish, and this morning it quickly broke down below its daily supports. It did rally back to close back above it, giving it another failed breakdown today. Similar to yesterday, it made a lower low so it still starts another downtrend here. The difference today is that it was actually a pretty strong finish and there is a chance for it to gap above its new primary downtrend (white) that it started today.
Its new primary downtrend (white) will be the first key level to watch for tomorrow which will be around 24,875. The Nasdaq closed at 24,876 today. So as long as there's no gap down tomorrow it should open above this new primary downtrend and that 24,875 area becomes support. From there on a pullback its prior downtrends (purple and yellow) will also act as support at about 24,800 and 24,750. If they don't hold, the last daily support will be from the bottom of its new primary downtrend (white) at 24,375-24,400.
If the Nasdaq fails to at least open flat above its primary downtrend tomorrow at the 24,875 level then this will be resistance on a rally attempt. The prior downtrends (purple and yellow) mentioned above will still act as support on a pullback unless the Nasdaq gaps below them tomorrow morning - in which case those would become resistance as well. If the Nasdaq does gap or break above its primary downtrend tomorrow then it will start a new trend heading into Thursday, but we'll need to see how it closes first in order to determine the direction of that new trend.
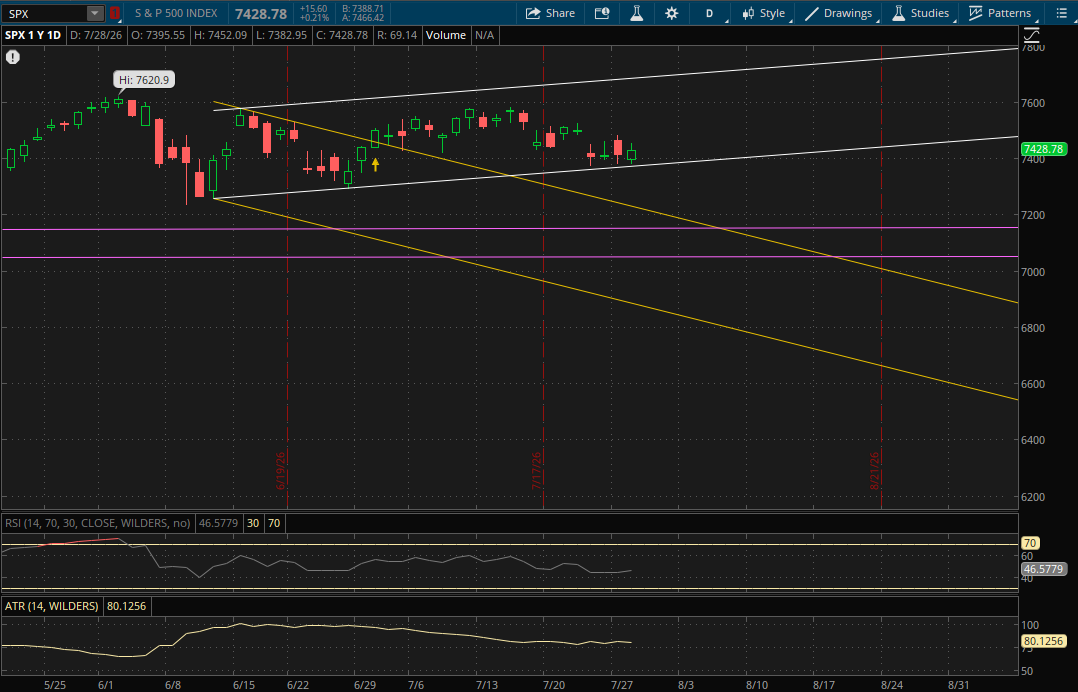
The S&P once again got close to its primary daily uptrend support (white) but did not break through it, so it doesn't start any new daily trends again. This will continue to be the first support to watch at about 7,375 tomorrow. If it doesn't hold, the next support to watch will be from its prior downtrend (yellow) at about 7,220. The last support to watch in the event of a big sell-off would likely be its prior sideways range (purple) at 7,150-7,155. On a rally the only resistance right now will be from its primary uptrend (white) around 7,685-7,690 which is about 3.5% away so it's very unlikely that it gets there. Instead it likely just continues to trade within this primary uptrend for now.
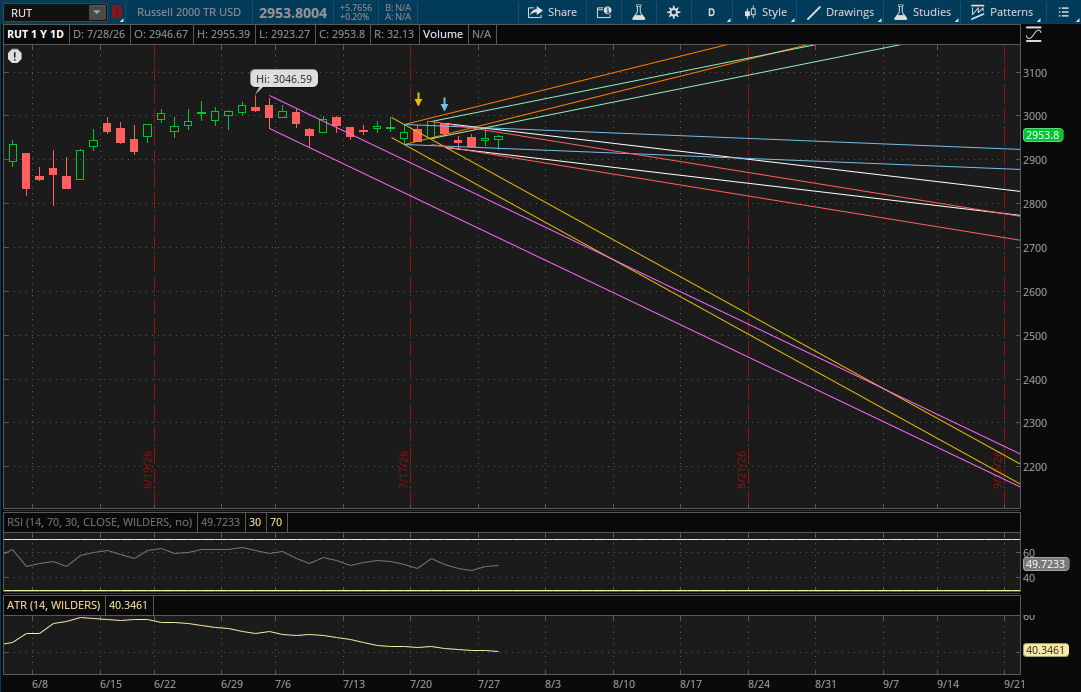
The Russell 2000 bounced right around its first support area of 2,925 (blue) this morning and didn't break through its primary range today. So it also doesn't start any new daily ranges here. For tomorrow the first resistance to watch on a rally attempt will be at 2,958 from its prior downtrend (red). It will have more resistances just above that at 2,965 from its primary downtrend (white) and then its next downtrend (blue) will be resistance at 2,970. If it can clear through all of these, its prior uptrends (green and orange) come into play at about 2,987 and 2,995.
On a pullback, the first support to watch will again be from its first downtrend (blue) around 2,924. After that, its primary downtrend (white) is next at about 2,909-2,910 followed by its next downtrend (red) at 2,904-2,905. If these don't hold, the last support likely in play tomorrow would be from its next downtrend (yellow) at 2,842-2,843.