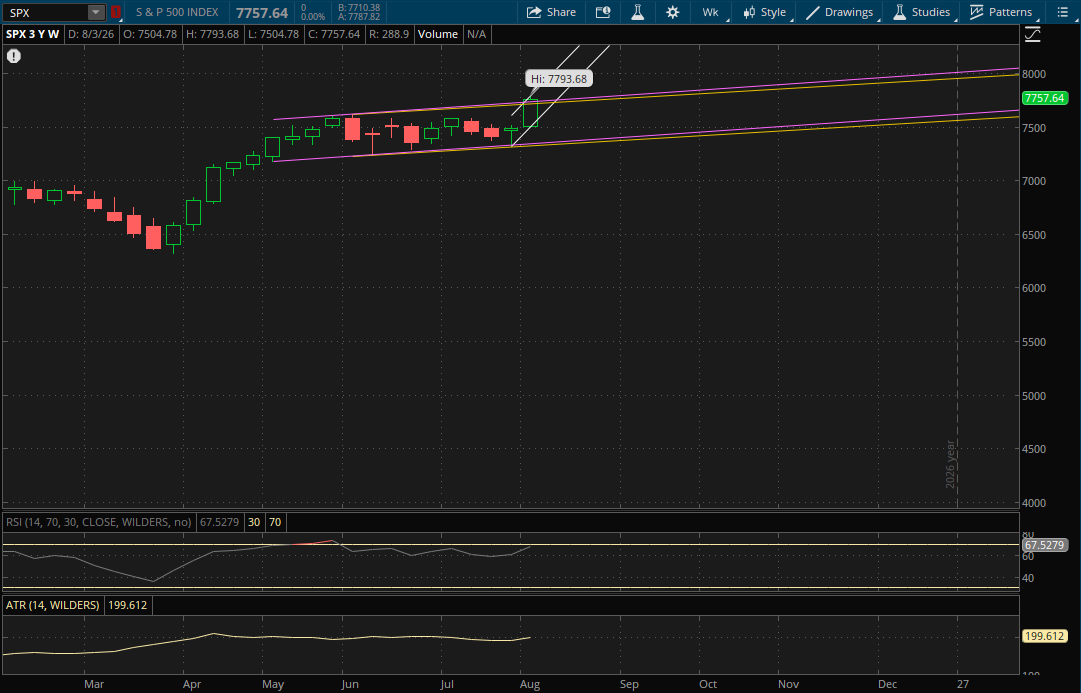
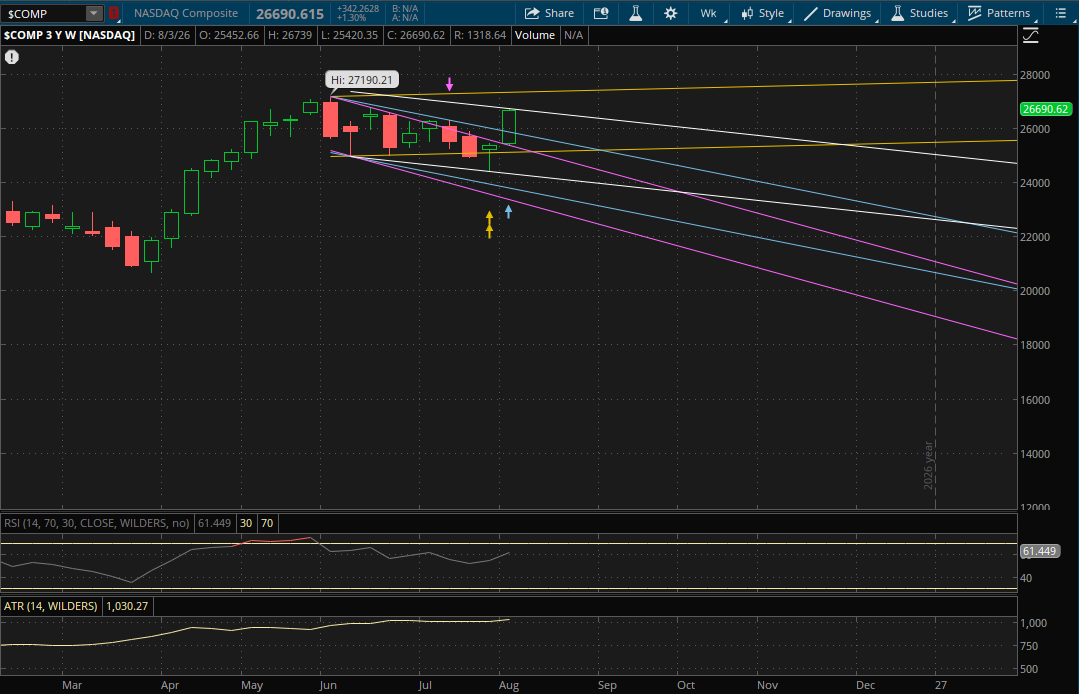
After the prior week's post Fed rally in the markets, they continued last week with the S&P reaching new all time highs and nearly touching 7,800. For the week the S&P gained 3.6% while the Nasdaq was even stronger, posting a weekly gain of 5.2%. The Russell 2000 also jumped 3.5% and snapped its 5 week losing streak. With the sharp rally in the markets last week, the VIX fell 6.8% to close at $14.90 which was its second lowest weekly close of the year. While it was a strong rally this week, there should be some caution with the VIX this low and sentiment becoming very frothy again.
This week we will get more earnings reports from the AI/semi themed stocks with AMAT, LITE, and CRWV being some of the larger names to report. But the focus will mostly be on July's CPI report that comes out on Wednesday at 8:30 AM ET. This will be the next big inflation data that the Fed will be watching ahead of next month's rate decision. Following Wednesday's CPI, we will get PPI on Thursday morning which is more inflation data from the producer's side.
Looking at the technical setup, it was a very strong finish for markets last week with the indexes finishing essentially at the highs of week. But as I said with the VIX this low, and sentiment getting frothy again, I am concerned of a pullback. The biggest risk right now from a technical perspective would be a weak open tomorrow to start the week. The Nasdaq did break above its previous primary downtrend, however it still starts a new primary downtrend as it made a lower low last week. This new primary downtrend (white) will be the first key level to watch at 26,650-26,675 which is just below last week's close of 26,690. This is why tomorrow's open is so important. If the Nasdaq gaps down below that 26,650-26,675 level tomorrow then it becomes resistance on a rally attempt. If it's a small gap down below it, it will likely still break above it, but it increases the chances of a close back below it to finish the week. But for now let's assume that it does open above it in which case the 26,650-26,675 area will act as support on a pullback. From there the only resistance to watch on a rally will be its prior uptrend (yellow) at 27,350-27,375.
Now let's assume the Nasdaq does get the gap down below the 26,650-26,675 area tomorrow. Its primary downtrend (white) becomes resistance and there is a bigger risk of a pullback or a failed breakout by the end of the week. On a pullback, the first support to watch would be its prior downtrend (blue) at 25,725-25,750. If that doesn't hold, its next downtrend (purple) around 25,175 with more just below it from its prior uptrend (yellow) at 25,125-25,150.
The S&P is in the same situation here as it was a strong finish for the week in the sense that it held nearly all of its gains and it broke and closed above its prior uptrends to start a new primary uptrend (white). However, it didn't break significantly above them and there is risk of a gap back below them tomorrow. The first level to watch will be from its prior uptrend (purple) at 7,750 which is just below last week's close of 7,757. After that, its next support will be at about 7,730 from its next uptrend (yellow). As long as it can open above both of these, they will act as supports on a pullback. For now the only weekly resistance to watch on another rally would be around 7,990 from the top of its new primary uptrend (white).
If the S&P does gap down below its prior uptrends (purple and yellow) at 7,750 and potentially 7,730, then those would both become resistance levels. And if it opens above them, but breaks down through them, the last support to watch would be from its primary uptrend (white) right around 7,700. The worst case scenario would be a gap below 7,700 tomorrow in which case its new uptrend becomes resistance as well and then we could see a larger sell-off towards the bottom end of its prior uptrends at 7,325-7,350.