The market was lower today on the back of increased tensions between Iran and the U.S. again. Oil jumped over 3% and settled above $84/barrel which also led to a rise in yields and put pressure on stocks. The 10 year yield climbed back over 4.7% and is once again near the July highs of 4.743%. The 30 year treasury yield meanwhile hit 5.31%, its highest level in nearly 2 decades. The S&P was actually the laggard today, falling 0.52%, while the Nasdaq and Russell 2000 each fell about 0.35%. Spot VIX was notably strong all day, even in the morning when stocks were slightly higher. Spot VIX (the VIX index) jumped 6.6% and closed back above $15 after hitting new lows for the year last week. However, the front month contract for the VIX was flat. The structure currently remains in contango, but with today's jump in the spot index the spread between spot and front month has narrowed significantly and if it continues the structure may flip into backwardation which has been at least a short tern warning sign of a market pullback in the past.
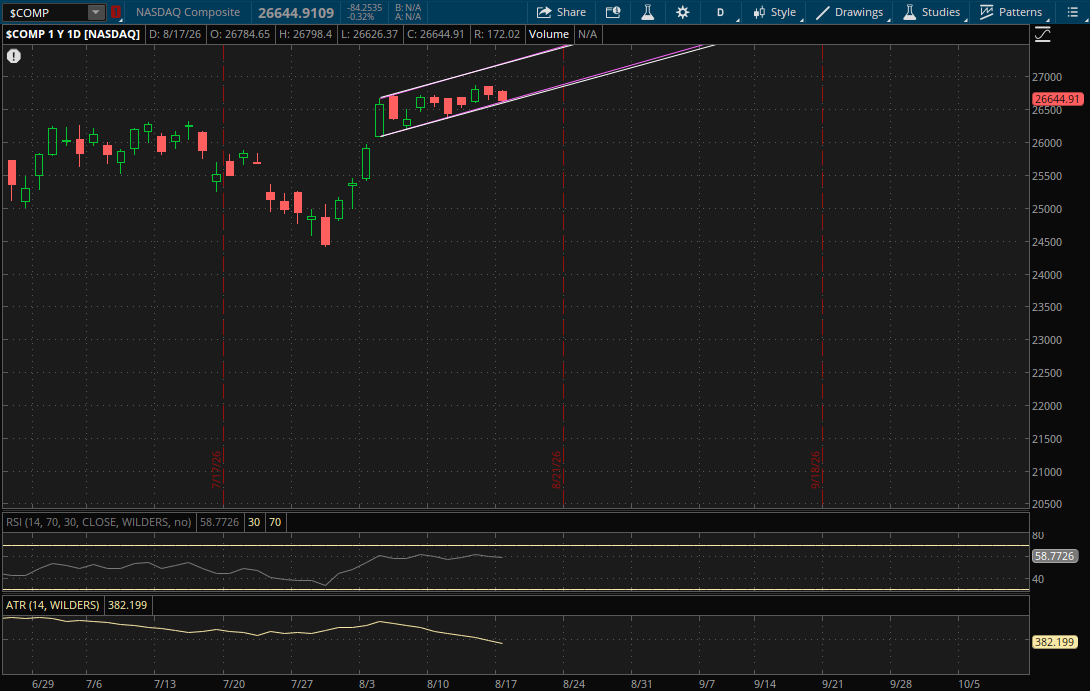
For the Nasdaq nothing changed on a daily time frame as it held its first support around 26,625 today (purple). Since it didn't break through its primary uptrend (white) it doesn't start any new ranges for tomorrow. With the weak finish today, there is risk of an open below its current uptrends tomorrow. The first key level to watch will be from its previous uptrend (purple) which it held today. That will be support/resistance around 26,680 tomorrow which is above today's close of 26,644. The only other support/resistance level to watch will be from its primary uptrend (white) around 26,660 which is also just above today's close. If the Nasdaq fails to gap above these levels tomorrow, they will act as resistance on a rally attempt. If it does gap or break below them, then it will start a new trend going into Wednesday's session but we'll first need to see how it closes to determine the direction of it.
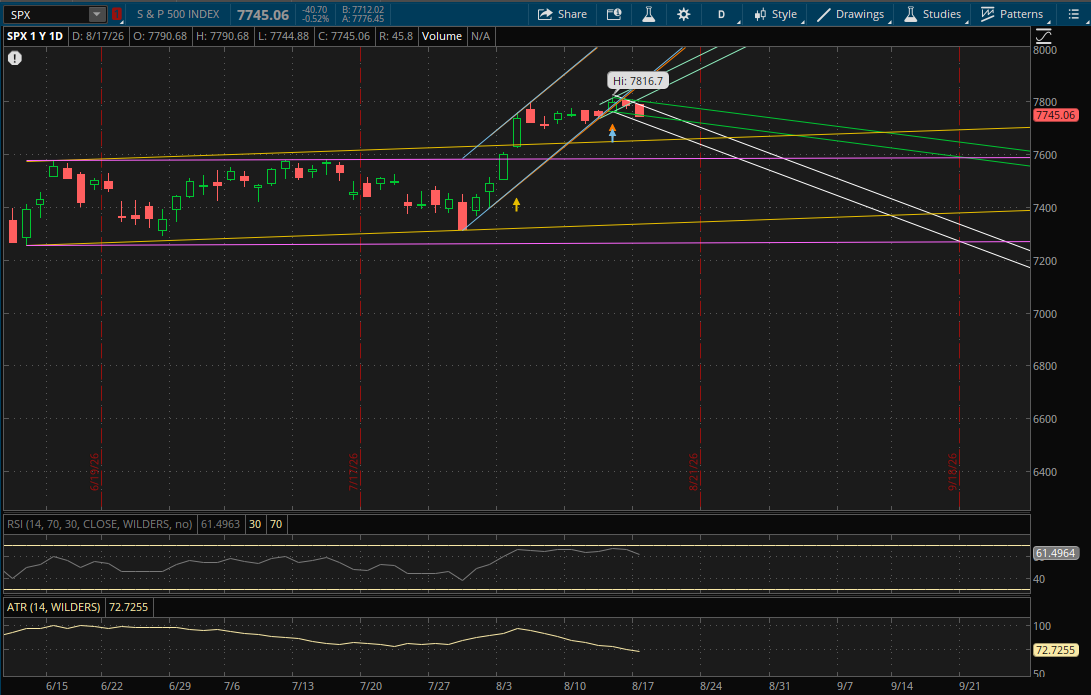
On Friday I wrote about how the S&P broke down a bit as it started a new daily downtrend and how there was risk of a pullback again. It got down to this daily downtrend support around 7,750 this afternoon and it broke and closed below it which starts another downtrend for it going into tomorrow.
Now the first key level to watch will be at 7,742-7,743 from the downtrend it closed below today (green). The S&P closed at 7,745 today, so it's just below today's close. If the S&P opens above the 7,742-7,743 area tomorrow, this downtrend that it closed below today will act as support. From there on a rally attempt its new primary downtrend (white) will be the first resistance to watch at about 7,770. If it can break through it, then its prior downtrend (green) will be the last daily resistance to watch from the top of the range at 7,796-7,797.
If the S&P fails to open above the first key level (green) at 7,742-7,743 or if it simply opens above it but breaks down below it, then the next daily support to watch will be from the new primary downtrend (white) that it started today which will be at 7,700-7,705. However there will also be weekly support before this at 7,740 (see the weekly update). If neither of these supports hold, the last daily support that would likely come into play tomorrow would be from its prior sideways range (yellow) around 7,655.
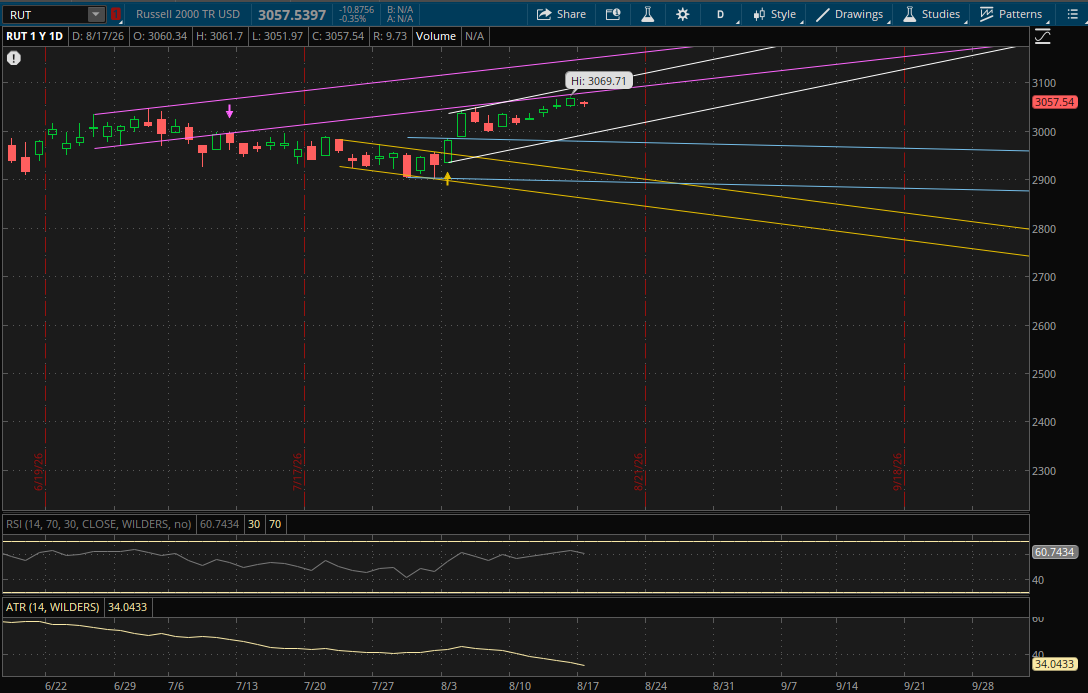
The Russell 2000 continues to chop around within its primary uptrend so it doesn't start any new ranges for tomorrow. On a rally attempt its prior uptrend (purple) will be the first resistance to watch at 3,082-3,083 with the last resistance being from its primary uptrend (white) right around 3,100.
On a sell-off the first support to watch will be from its primary uptrend (white) which is just under 3,000. If that doesn't hold then the last daily support that would potentially be in play would be from its prior downtrend (blue) around 2,980. It's also possible that it simply continues to trade within its primary range for now like it has been for the past couple of weeks.