The Nasdaq and S&P finished higher this week with weekly gains of 1.5% and 0.50%, respectively. Small caps were the laggard as the Russell 2000 lost 1.5% which mostly came on Friday after Kevin Warsh's speech at Jackson Hole. The speech mostly came off as hawkish with treasury yields and the Dollar rallying. The 10 year treasury yield climbed back near 4.73% while the strength in the Dollar sent precious metals lower. Gold fell nearly 3.5% after a big 15% rally over the past few weeks while Silver also fell 4.5%. For next week the biggest catalyst will come on Friday with the August jobs report. Last month's report was surprisingly weak as the economy lost 23,000 jobs vs the expectation that it would add around 85,000. For August, expectations have dwindled with the economy expected to add just 55,000 jobs and for the unemployment rate to tick up to 4.2% from 4.1%. We will be going into a 3 day weekend next week with markets being closed on the following Monday, September 7th, for Labor Day.
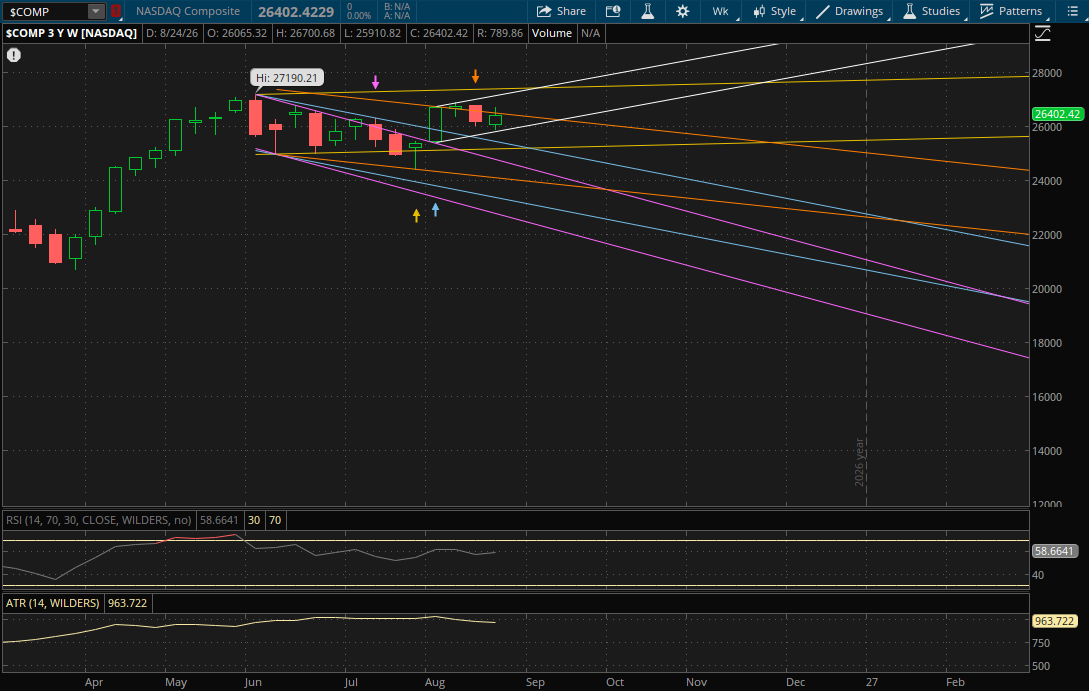
From a technical perspective, the Nasdaq did hold its primary weekly uptrend which it started last week. It got close to that 25,825-25,850 level that I mentioned in last week's update, putting in a low of 25,910. Since it didn't break through its primary uptrend, it doesn't start any new ones for next week. On another rally attempt, the first resistance to watch will be from its prior downtrend (orange) at about 26,425. If it breaks through that, the next weekly resistance will be from its primary uptrend (white) at 27,275-27,300. The last weekly resistance to watch would be from its prior sideways range (yellow) at 27,400-27,425.
On a pullback, its primary uptrend (white) will again be the first support to watch around 25,975. If it doesn't hold this time, the next weekly support will be farther away around 25,300 from its prior downtrend (blue). If that doesn't hold, there will be more just below it around 25,200 from its next uptrend (yellow).
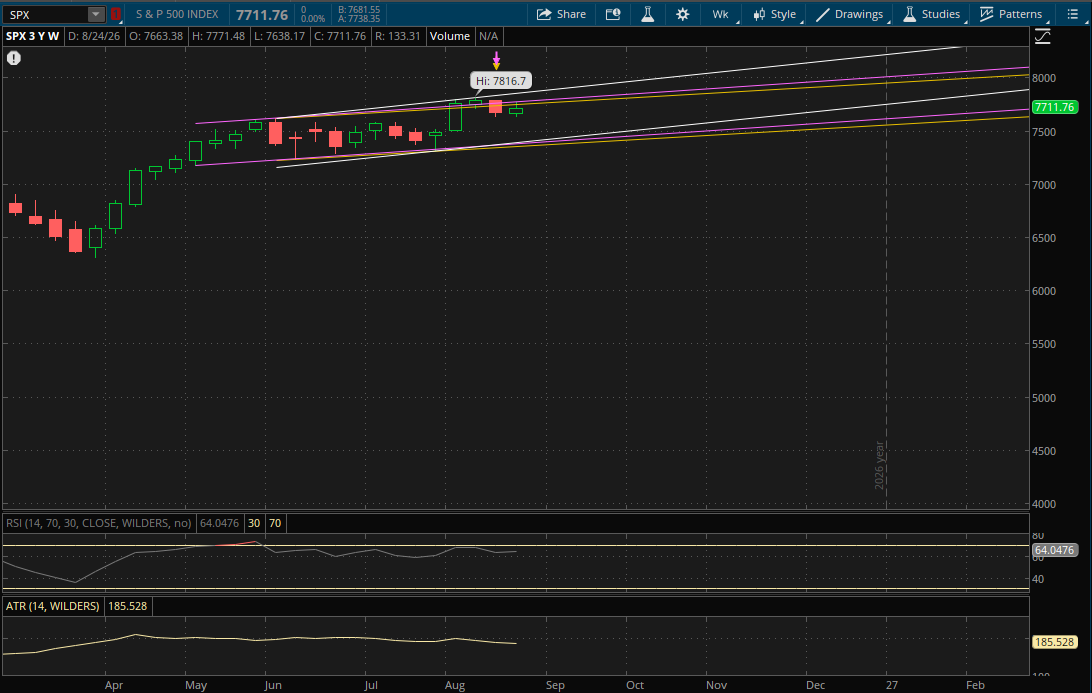
The S&P had a strong breakdown 2 weeks ago and it did get rejected at the 7,770-7,775 weekly resistance that I laid out in last weekend's update. It didn't break through its primary uptrend or invalidate any of its prior trends, so it doesn't start any new trends for next week. The first resistance to watch on another rally attempt will be from its prior uptrend (yellow) at 7,760-7,765. It broke above this trend yesterday, but didn't invalidate it. If it breaks through it again, the next resistance will be at 7,785-7,790 from its next uptrend (purple) which it did get rejected at yesterday. If it breaks through it this time, the last weekly resistance will be from its primary uptrend (white) at 7,875-7,880 which would be new all time highs for it.
On a continued pullback, the next weekly support will be at 7,410-7,415 from its primary uptrend (white). I think the more likely scenario is that we get this pullback over the next 1-2 weeks. If it gets there next week and doesn't hold, it would have more supports from both of its next 2 uptrends (purple and yellow) at 7,390-7,395 and then about 7,370. If we do get this pullback, it would be a good dip buying opportunity for now.
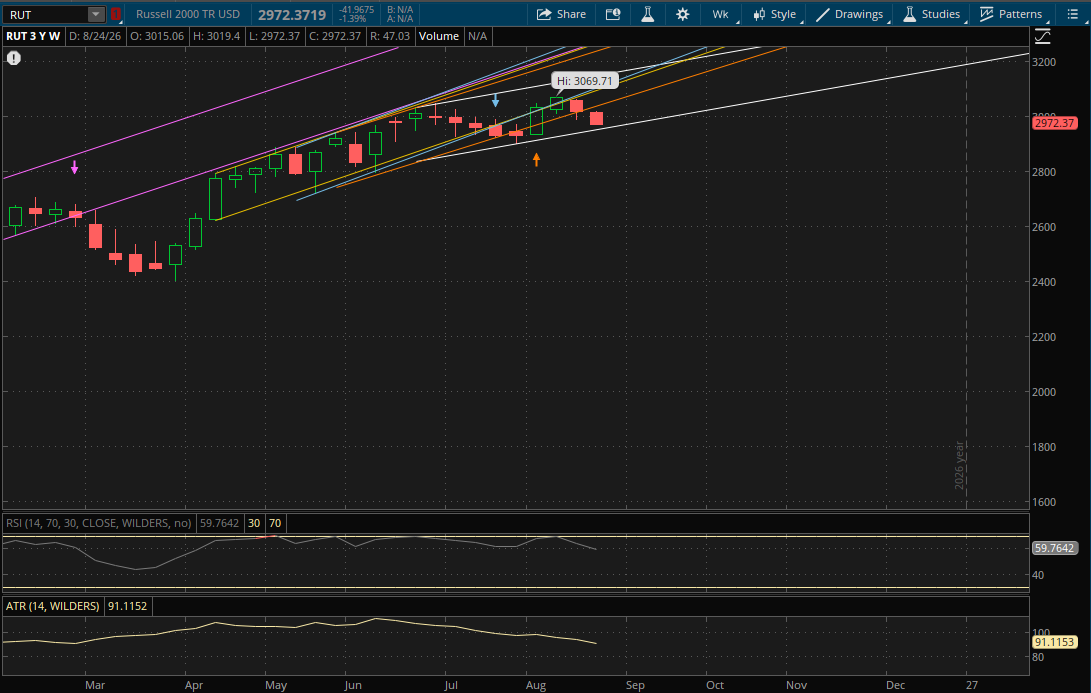
The Russell 2000, which was the worst performing this week, didn't break through its primary uptrend so it doesn't start any new trends for next week. If there is a bounce back the only resistance to watch will be from its prior uptrend (orange) at 3,060-3,065. And on a continuation of the pullback the only support to watch will be from its primary uptrend (white) at about 2,966-2,967. If it breaks through its primary uptrend it will start a new one for the following week but we'll first have to see how it closes to determine the direction of it. Since the Russell 2000 closed at 2,972, there is also risk of a gap below its primary uptrend next week at that 2,966-2,967 level. If we do get this gap down on Monday then that 2,966-2,967 level from its primary uptrend would act as resistance on a rally attempt.