Over the weekend the U.S. confirmed that they continued their attacks on Iran which caused oil to jump 3.5% today. This subsequently led to a rise in treasury yields with the 10 year climbing to 4.78% which is near the 4.809% high of the year which was set back in January. The rate sensitive Russell 2000 was once again the laggard, closing down 0.54% while the S&P lost 0.33%. Tech was the best performing, closing down just 0.12% after a late day rally. The VIX gained 3.4% to settle at $14.92, but this was near the lows of the day. It had been up over 7% at the highs.
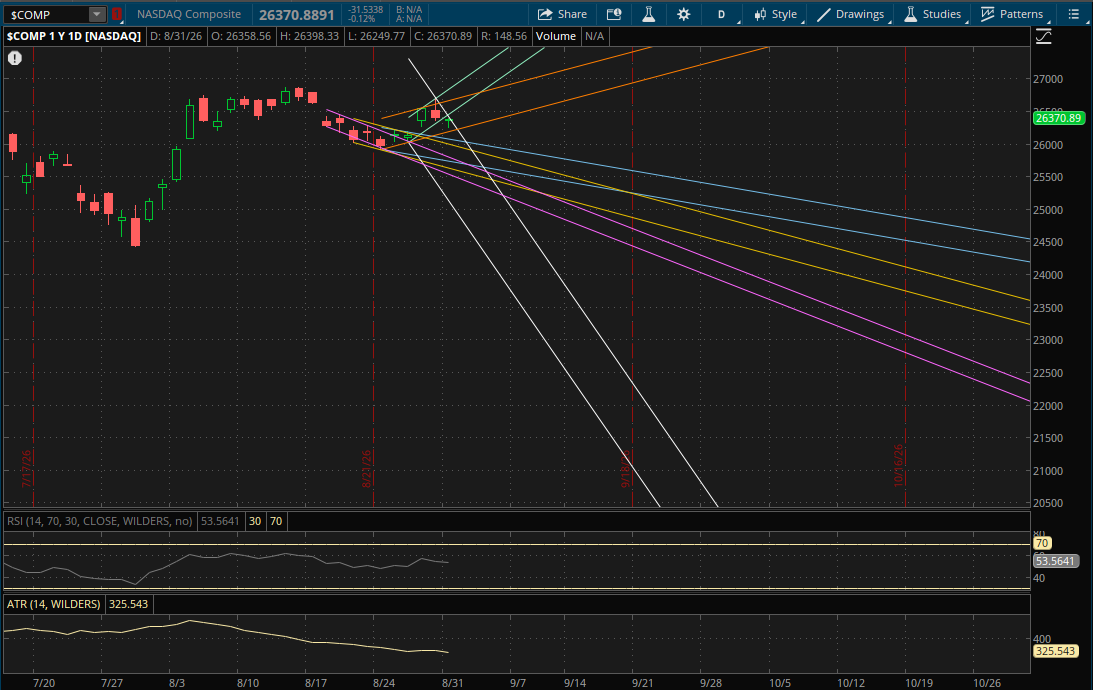
In the last daily update I noted that the Nasdaq and S&P both had failed breakouts which helped lead to today's pullback, even though the dip was bought again. The Nasdaq gapped and closed below its primary uptrend from Friday's failed breakout which now starts a new primary downtrend for it. However, it was a strong finish with the end of day rally back in stocks and it's very likely that we get an open above its new primary downtrend (white) tomorrow. For tomorrow, the first key level to watch will be right around today's low of 26,249.77. This area (26,240-26,250) will be support from its prior uptrend (orange) assuming we don't get a gap below it. The Nasdaq closed well above it at 26,370 today, so it's unlikely that we'll get that gap down in which case that 26,240-26,250 area will act as support. The only resistance that likely comes into play on a rally attempt tomorrow would be from its prior uptrend (green) at 26,600-26,625.
If we do get a pullback and the first support at 26,240-26,250 (orange) doesn't hold, the next support will be from the new primary downtrend (white) that it started today. That will be support at 26,080-26,090. If that doesn't hold either, the last support that likely gets tested would be its next downtrend (blue) around 26,050.
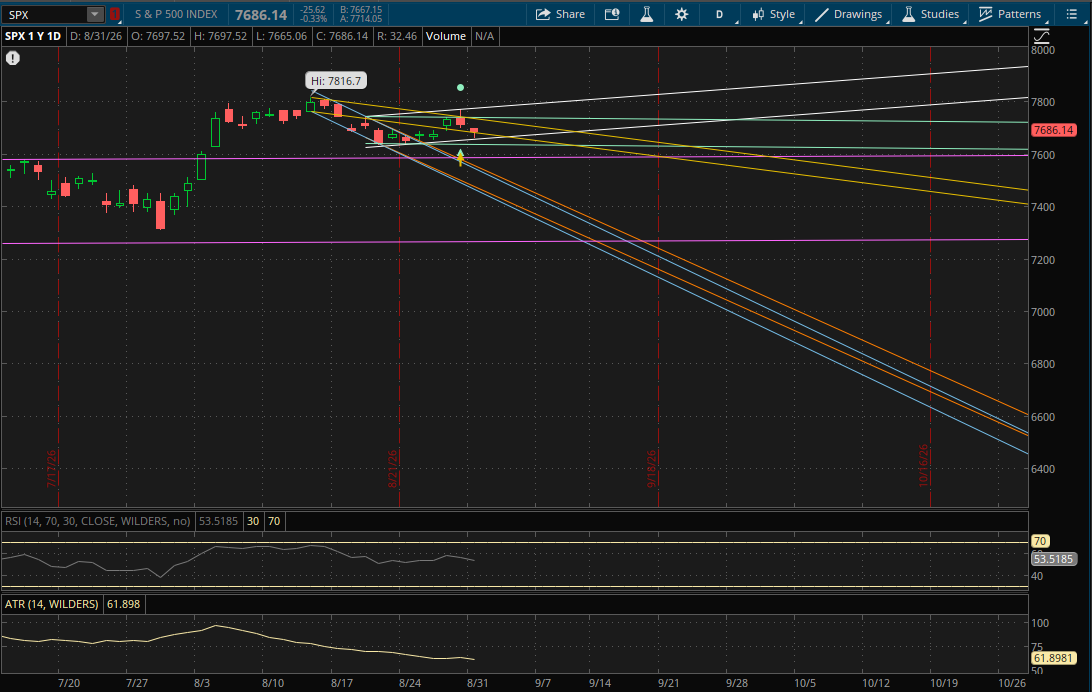
The S&P nearly reached its primary uptrend support around 7,658. It didn't break through it as it put in a low of 7,665.06, so it doesn't start any new trends for tomorrow. On a bounce tomorrow the first resistance to watch will be from its prior downtrend (yellow) at 7,729-7,730. If it breaks through it, the next downtrend (green) will likely be the last resistance that comes into play around 7,740.
On a continuation of the pullback, the first support to watch will be from its prior downtrend (yellow) which it closed back over today. That will be support at about 7,676 which is just below today's close of 7,686. If it were to gap below it, then the 7,676 area would become resistance. After that, its primary uptrend (white) would be the next support to watch at about 7,662. The last potential support to watch on a continued pullback will be from its prior sideways range (green) at 7,635-7,637.
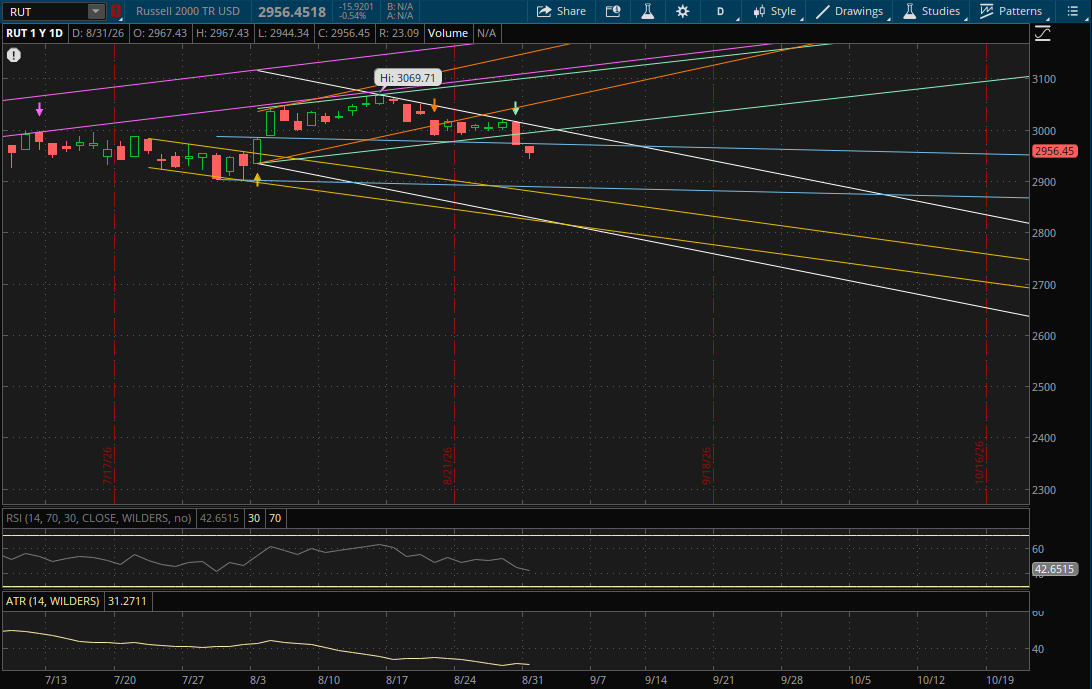
The Russell 2000 started a big downtrend on Friday and it gapped below its prior downtrend (blue). This will now be the first resistance level to watch on a bounce attempt at about 2,973 tomorrow. If it breaks through it, the next resistance will be at about 2,998 from its prior uptrend (green) and finally its primary downtrend (white) will be resistance at 3,006.
On a continuation of this pullback for small caps, the next support to watch will be from its prior downtrend (blue - bottom of the range) around 2,890. If that doesn't hold, the last daily support that could potentially come into play would be from its prior downtrend (yellow) at 2,877-2,878 if we were to get a larger sell-off.