Small caps were the biggest loser this week as oil and rates soared with the 10 year treasury yield hitting its highest level since 2023 where it peaked just above 5%. The 10 year broke above 4.96% this year, nearly reaching those 2023 highs, as oil broke above $100/barrel again. The Russell 2000 closed down 2.4% for the week while the Nasdaq and S&P lost about 0.70% and 0.80%, respectively. With the pullback this week, the VIX gained 9%, however it finished near the lows of the week with the markets bouncing back on Friday.
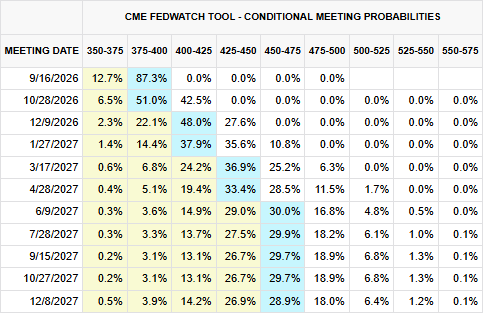
For next week the big catalyst is the Fed rate decision on Wednesday, September 16th, at 2:00 PM ET. This will be followed up by Fed Chair Kevin Warsh's press conference at 2:30 PM ET. With this week's PPI and CPI coming in slightly hotter than expected, odds of a rate hike have continued to increase and currently the market is pricing in a 25bps hike with about a 87% probability while no change sits at about 13%. Not only that, but there is now another hike being priced in by end of year and 2 more hikes being priced in for 2027.
Source: CME FedWatch
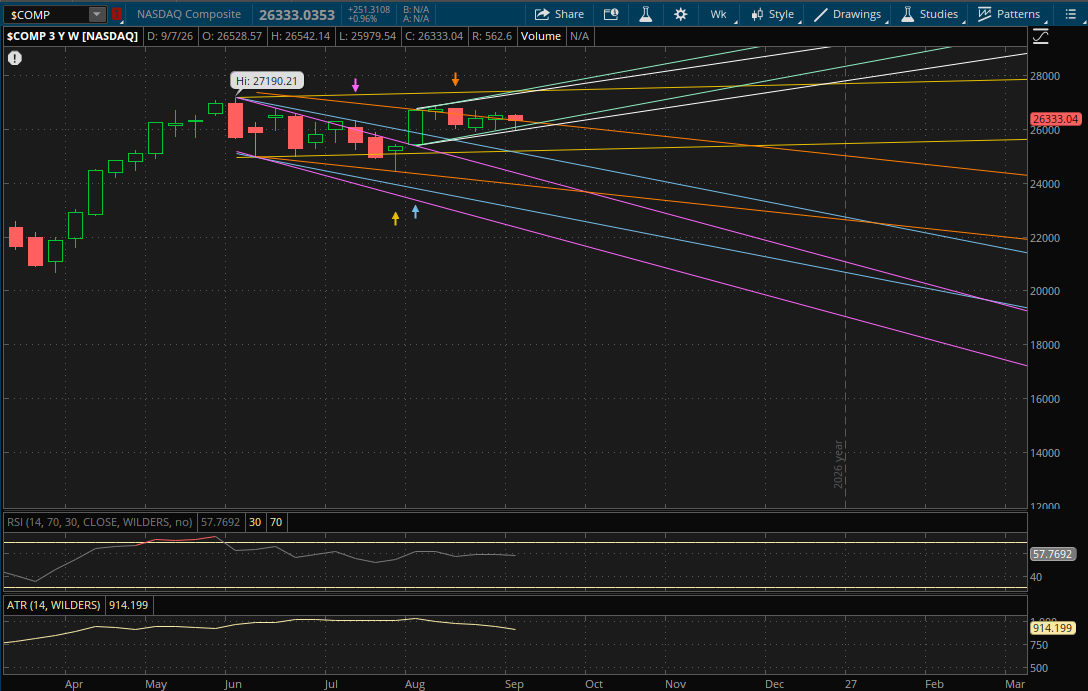
From a technical perspective, the Nasdaq had a failed breakdown this week, however it wasn't a strong one. But it does start a new weekly uptrend with the failed breakdown which will provide an additional level of support for now as long as it doesn't gap below them on Monday.
First we'll look at resistances which are pretty far away at the top of these weekly ranges. Its new primary uptrend (white) and its prior uptrend (yellow) will be the 2 levels of resistance to watch at 27,425-27,450 where the 2 trends intersect. This area is over 4% away from this week's close and while I think it's unlikely to actually reach it, it is possible as we have a major catalyst with the Fed. So if there is a big rally next week, that would be the big resistance level to watch.
On a pullback, the first support level to watch for next week will be from its prior downtrend (orange) which it has broken through several times now, but hasn't invalidated it yet. That downtrend will continue to be support at 26,250-26,275. If it breaks again, it will have more support just below it around 26,240 which will be a retest of last week's failed breakdown (green). After that, its new primary uptrend support (white) will at 26,090-26,100. This primary downtrend is less than 1% away and it is possible that there is a gap below it next week, in which case that level and the other supports I mentioned would all end up being resistances. After those levels, the next big weekly support level will be around 25,225 from its next uptrend (yellow). The last support to potentially come into play with a big sell-off would be right around 25,000 from its prior downtrend (blue).
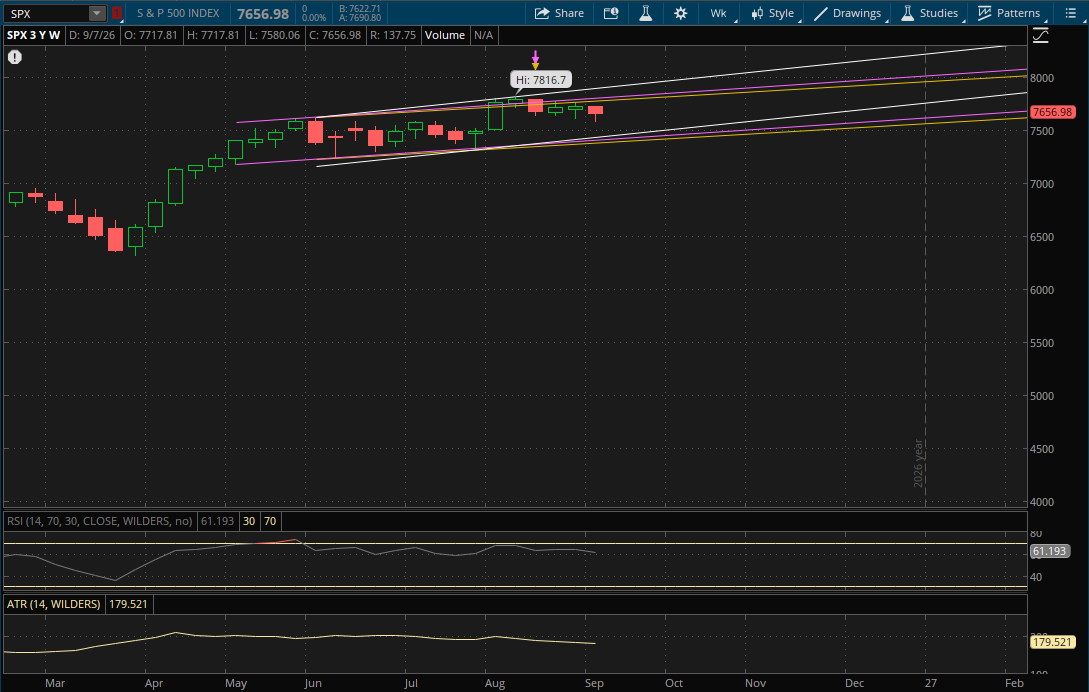
The S&P continues to trade within its big primary uptrend so it doesn't start any new weekly ranges for next week. Its prior uptrends (yellow and purple) will continue to be the first resistances to watch on another rally attempt at about 7,785 (yellow) and then 7,810-7,815 (purple). If it breaks through them, the last resistance would be from its primary uptrend (white) around 7,915.
As I've been mentioning over the past few weeks, I believe the S&P will continue lower 7,400 before any potential bottom. It's been extremely choppy and because it has taken so long for this pullback to happen, those support levels have moved up as it remains in an uptrend. Its primary uptrend (white) will now be support at 7,450-7,455 if we get a sell-off next week. If that doesn't hold, its last 2 supports will be from the next uptrends again at 7,415-7,420 (purple) and 7,390-7,395 (yellow). A pullback to these levels is still the more likely scenario in my opinion.
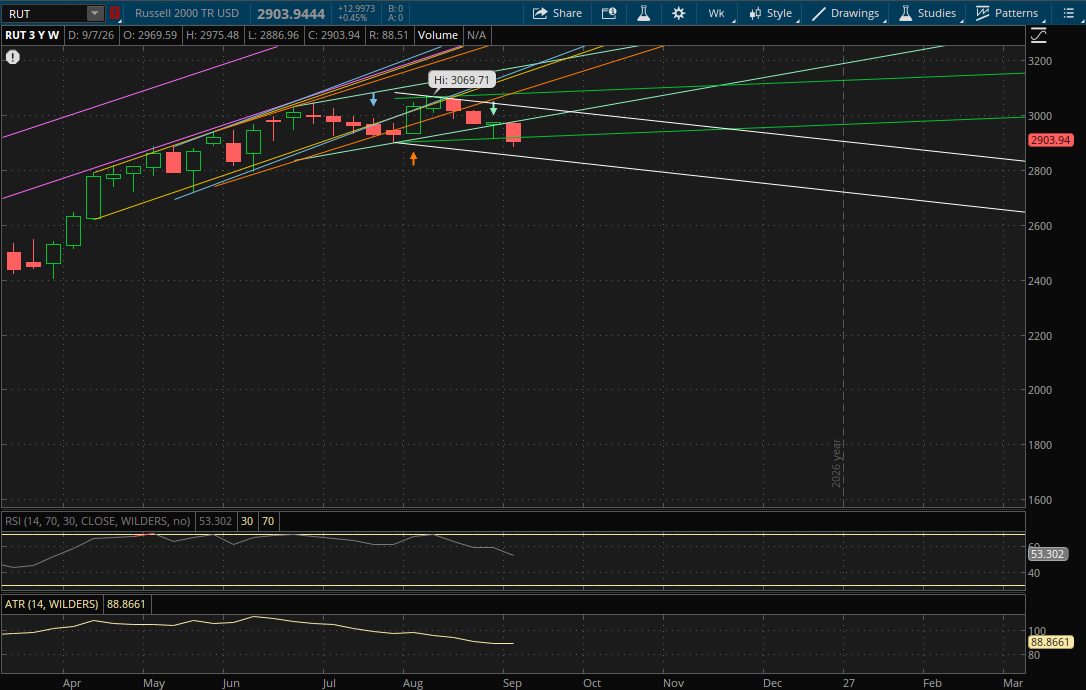
Last week the Russell 2000 put in a strong failed breakdown, however in last weekend's update I noted that it had to gap above 2,980 this week for that bullish reversal to play out. It failed to get this gap up on Monday, so the 2,980 level became resistance instead (see the prior weekly update). The early rally attempt also failed right around this 2,980 level as it put in a high of 2,975.48 before continuing lower throughout the week. It then broke and closed below it previous primary uptrend, so now it starts a new primary downtrend.
First let's look at resistance levels. If there's a bounce back this week on the Fed's rate decision, the first resistance to watch will be at about 2,923 from its prior uptrend (green) which it broke and closed below this week. If it were to break through it, the next weekly resistance will be at 2,990-2,995 from the next uptrend (teal). After that, the last weekly resistance to watch would be from its new primary downtrend (white) at 3,025-3,030 in the event of a big rally.
On a continuation of this sell-off in small caps, the only weekly support to watch will be from its new primary downtrend (white) at 2,845-2,847 which is only about another 2% away from this week's close at 2,903. If it doesn't hold, it would start a new weekly downtrend regardless of how it closes as it would be making a lower low. However, we'd need to wait to see how low it gets and how it closes to determine the direction of that new trend.