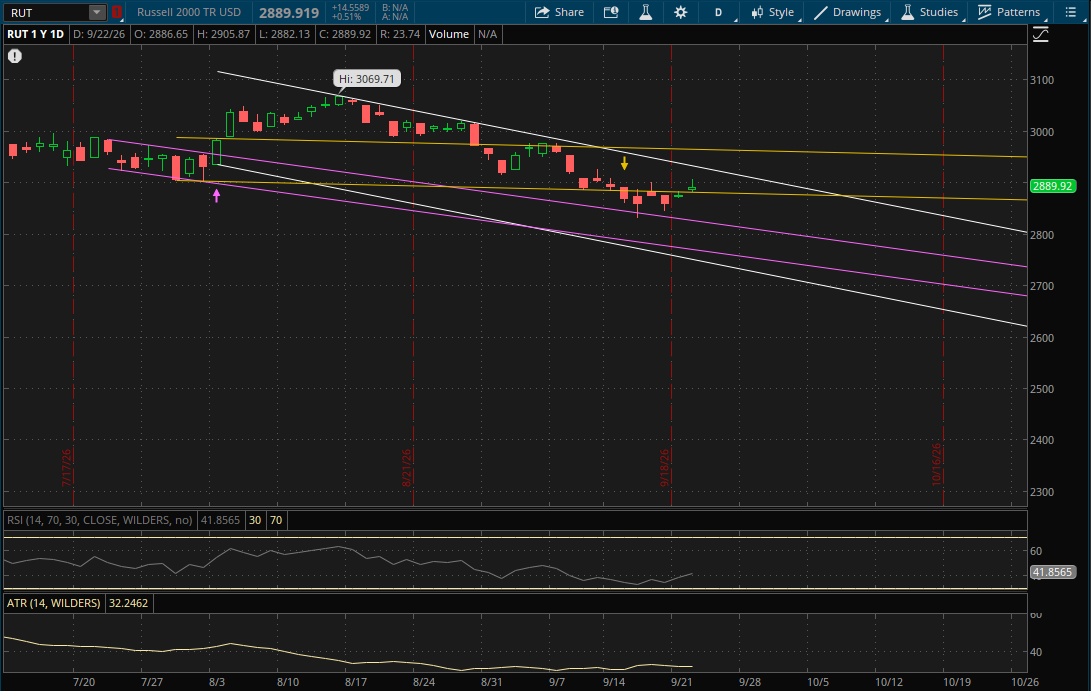
The Nasdaq reached a new all time high today, breaking above the prior all time high from June. It closed up 0.45% today while the Nasdaq 100 (NDX) gained 0.82% - also reaching a new all time high. The Russell 2000 gained 0.51%, however it finished near the lows of day again and the S&P finished flat. So the leadership was mostly in tech today. The VIX fell about 4.5% to settle at $14.21 as it approaches the 2026 low again.
Today the Nasdaq continued higher within its big primary daily uptrend (white), but as I mentioned in yesterday's update - it won't continue in this uptrend for very long. I started a short position in QQQ today, buying the September 30th (quarterly) $740/$730 put spreads for $2.25 (average) which I added to into the close because of this current parabolic daily uptrend and the fact that it is also nearing weekly resistance.
For now, nothing changes technically on the daily time frame as the Nasdaq did not break through its primary uptrend (white) today. This is the only daily resistance to watch for now, but again it won't reach that level as the top of the range is almost 10% away and will continue to rise. So while it can continue to trade higher within this uptrend for now, it is very likely that it will break down below it to start a new trend. The first support will continue to be from this primary uptrend (white) at 27,140-27,150 which is only about 0.40% away. If it were to potentially gap below it then this level would become resistance. If it opens above it, but breaks down below it, then the next support (blue) would be at about 26,575-26,600 over the next couple of days.
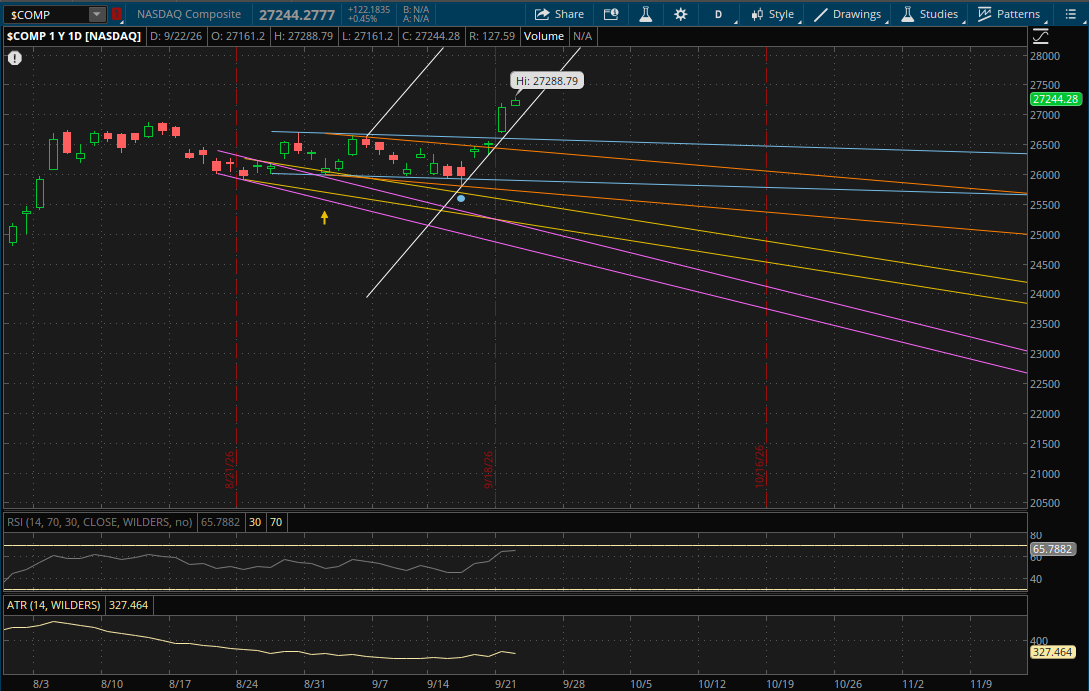
The S&P also remained within its new primary uptrend today, so it doesn't start any new daily ranges either. Its primary uptrend (white) will again be the first level to watch tomorrow at 7,765-7,766 which is right around today's close of 7,764.64. So it's very likely we could see a gap below it tomorrow. But first let's look at resistances. If it does open a bit higher above the 7,765-7,766 primary uptrend, then this level will continue to act as support for now. From there its prior uptrend (yellow) would be the next resistance to watch at about 7,840. If it clears through that, its primary uptrend (white) will be the last resistance to watch from the top of the range at about 7,885.
Now if the S&P does open flat/lower below its primary uptrend at 7,765-7,766 then this level would become resistance tomorrow. If it opens above it, but breaks down below it, then the next support will be at about 7,728 (orange) followed by its next uptrend (yellow) at about 7,722. After that, the 7,610 area would be the next support to watch from its orange uptrend again (bottom of the range) if we get a larger pullback.
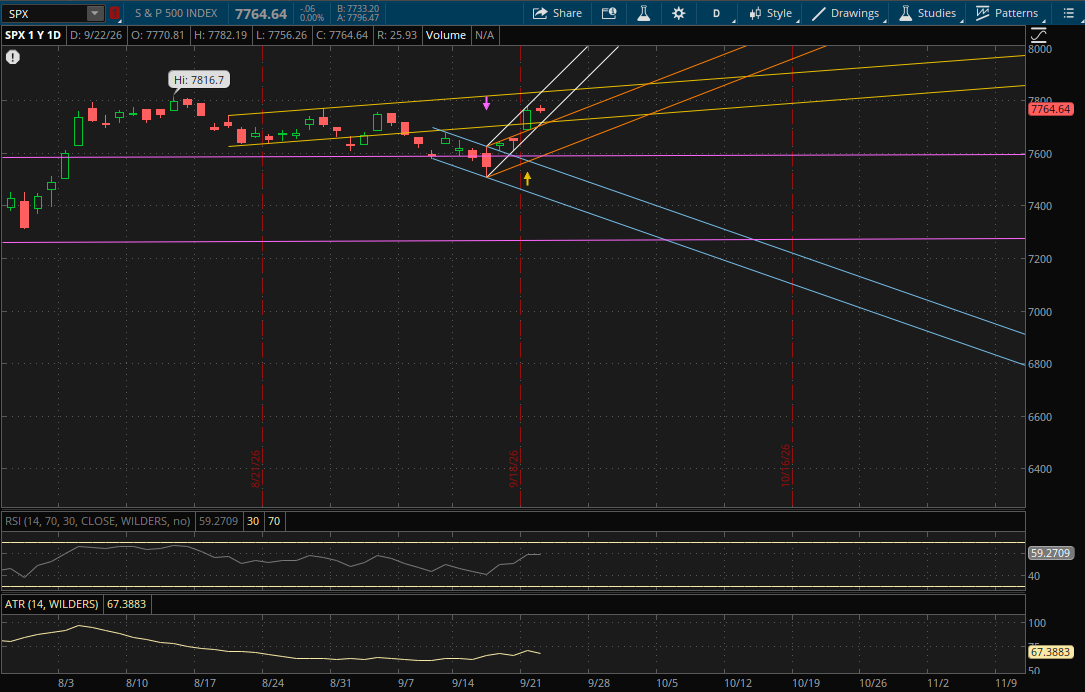
The Russell 2000 gapped back over its first trend (yellow) at about 2,881 this morning, so this area became support again rather than resistance. It did hold it as well as it put in a low of 2,882.13, but it was a weak finish again near the lows of day. It hasn't invalidated this level yet so it will continue to be the first area to watch again around 2,881. If it opens above it, it will be support again and the next resistance to watch on another rally attempt will be from its primary downtrend (white) at about 2,927.
If the Russell gaps below the 2,881 area again (yellow) then this trend becomes resistance again. If it opens above it, but breaks through it, then the only other support that likely comes into play tomorrow will be from its prior downtrend (purple) at about 2,823.