Oil pulled back a bit today, falling over 2% with mixed reports between the U.S. and Iran on a potential deal to open the Strait of Hormuz and bring an end to the war. However, yields didn't react much to this as the 10 year treasury yield hit a new high before pulling back to finish flat. The Nasdaq and S&P led the way higher with each index gaining about 0.50% while the Russell 2000 continued to lag, closing up just 0.07%. The VIX fell over 5% to settle back below $15 at $14.87.
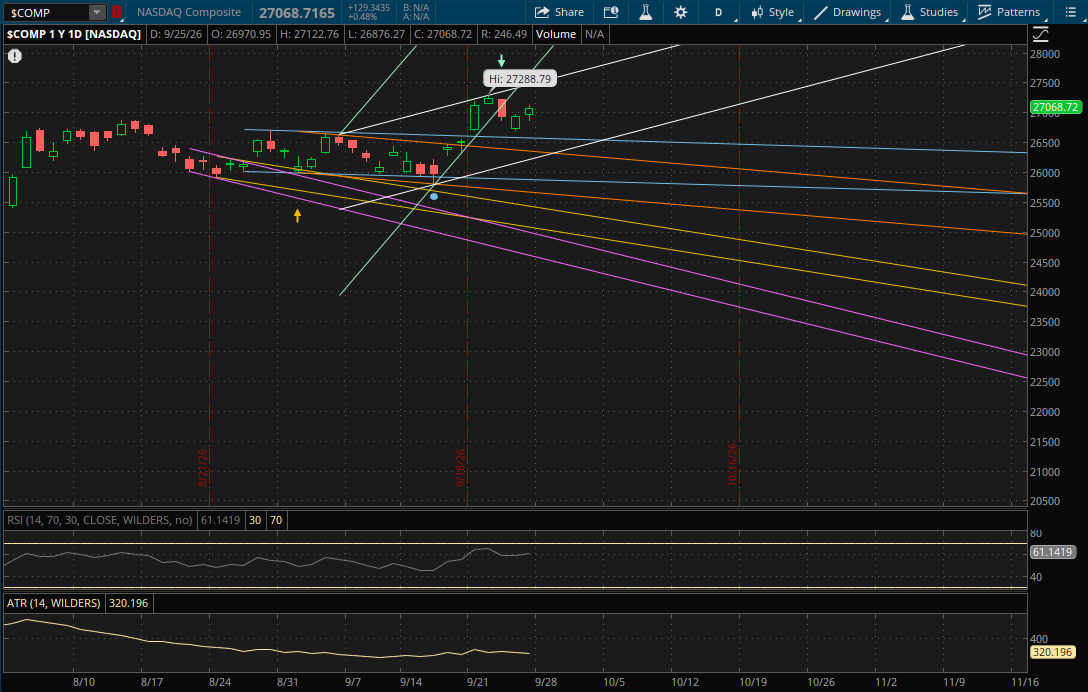
For Monday, nothing changes on the daily chart for the Nasdaq as it continues to trade within its big primary uptrend (white). This will be the only resistance level to watch at 27,525-27,550 on a continuation of the rally. If there's another pullback, the first support to watch would be from its prior downtrend (blue) at 26,550-26,575. If that doesn't hold it will have more support from its next downtrend (orange) at 26,325-26,350 and its last daily support will be from its primary uptrend (white) at 26,275-26,300.
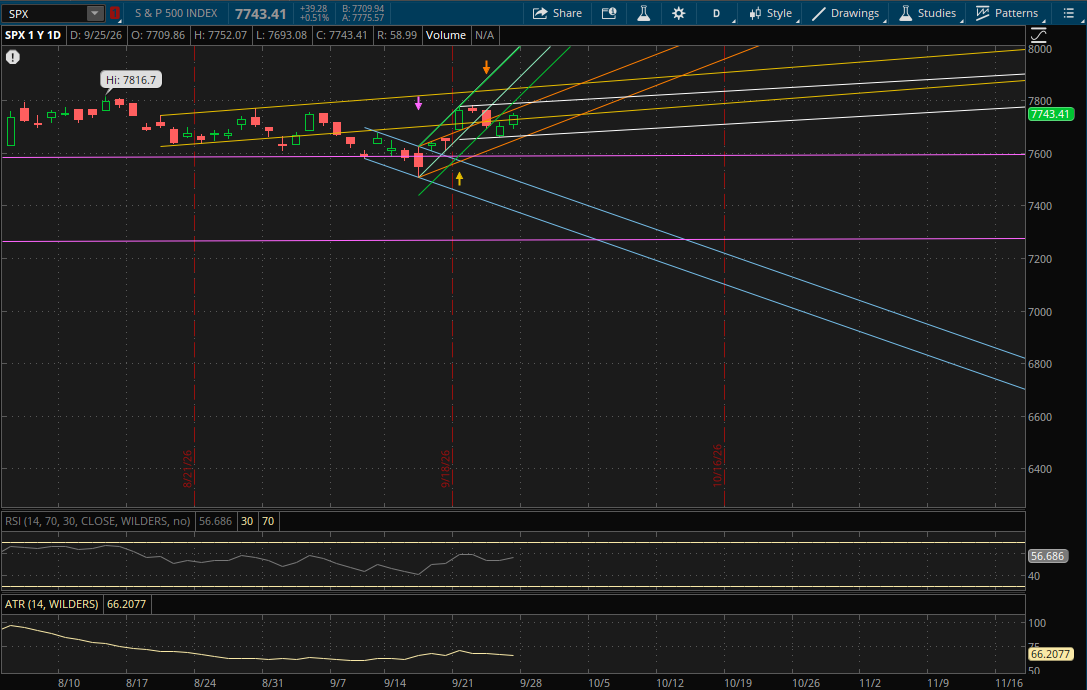
The S&P also remained within its primary sideways range (white) so it doesn't start any new daily ranges for Monday either. On another rally, the first resistance to watch will be at about 7,788 from its prior uptrend (orange) with the last resistance just above it around 7,795 from its primary range (white).
If we get a pullback, the first support will be from its prior uptrend (yellow) at 7,733-7,734. The S&P closed at 7,743 today, so it could potentially gap back below this yellow uptrend in which case it would end up being resistance instead. If it does gap or break below it, the last daily support to watch will be at 7,669-7,670 from both its next uptrend (orange) and its primary range (white) where the 2 intersect.
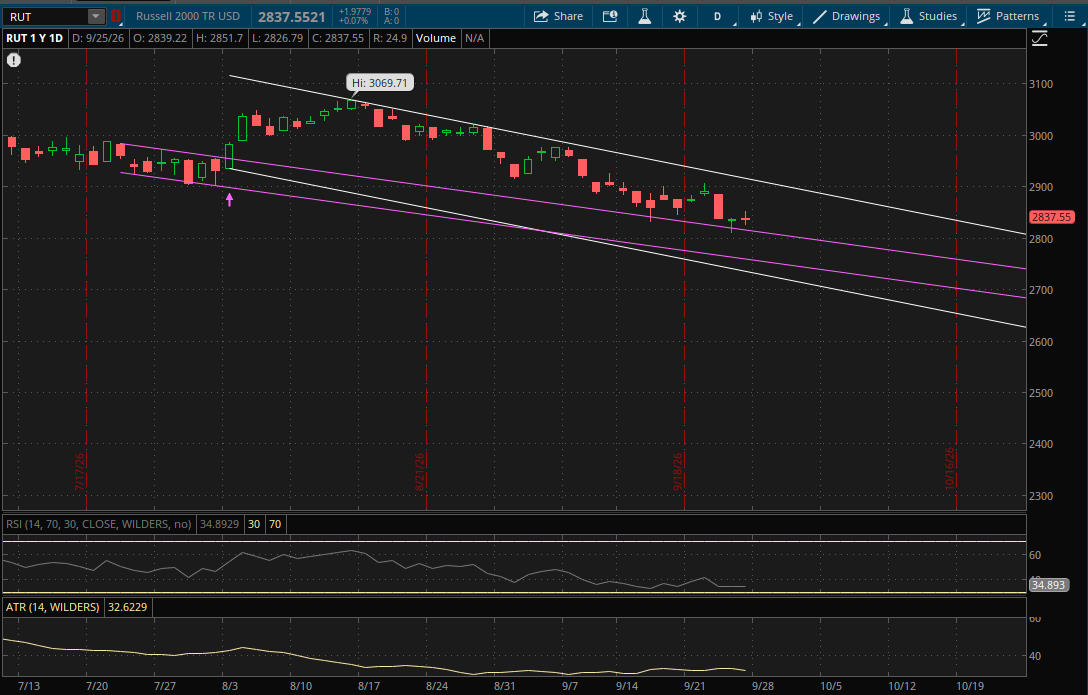
The Russell 2000 had a weak finish again as most of its gains faded, but it continues to trade in its big primary downtrend so it doesn't start any new daily ranges again. Its primary downtrend (white) will again be the only resistance to watch at about 2,910 on a rally on Monday.
On another pullback, its first support will be from its previous downtrend (purple) at about 2,812. If that doesn't hold, this same downtrend (bottom of the range) will be the next support at 2,755-2,757. After that, the last daily support will be from the bottom of its primary downtrend (white) at 2,729-2,730 if we were to get a big sell-off.