The 10 year treasury yield rallied again today, climbing over 1% for the day to close above 5.23%. Oil did jump over 4% at the highs today after President Trump rejected Iran's terms to reopen the Strait of Hormuz over the weekend. However, there were reports today that Trump was ready to ease economic sanctions on Iran and release their frozen assets in exchange for nuclear concessions. The markets rallied sharply on this news during the day with oil fading to close up just 1%. However, the market rally did not hold and they faded most of the bounce into the close. Tech was the laggard today with the Nasdaq closing down 0.92% while the S&P lost 0.77%. The Russell 2000 was the outperformer despite yields continuing to climb, though it also closed down by 0.69%. With the pullback in markets today, the VIX jumped 8% to close at $16.07.
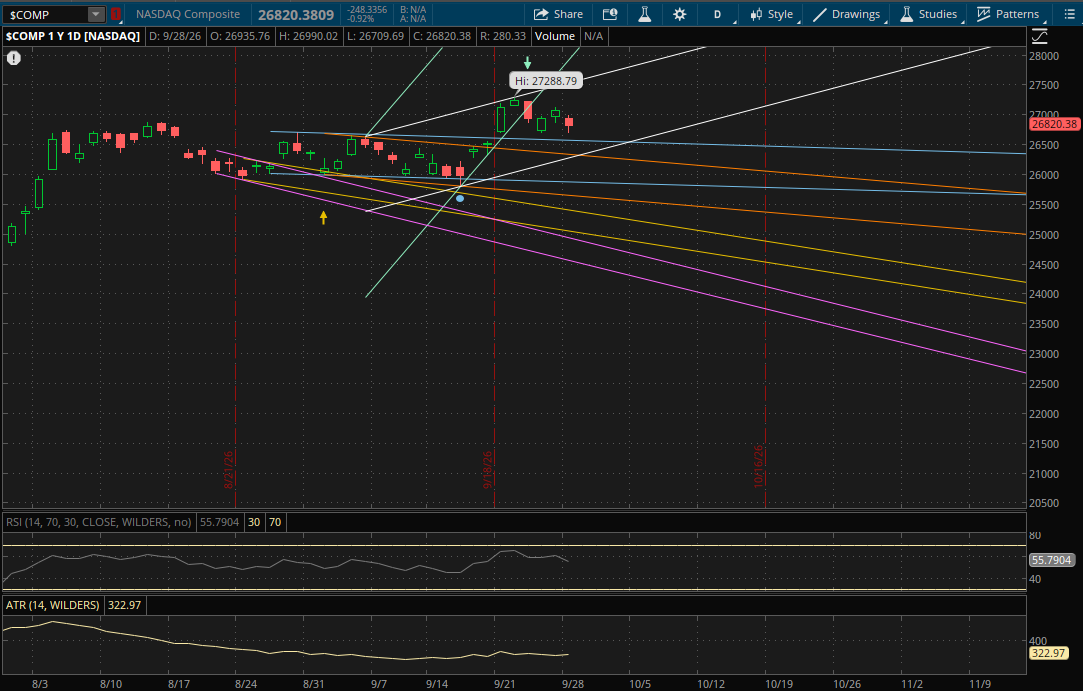
Looking at the technical setups now, the daily chart remains the same for the Nasdaq as it continues to trade within its big primary uptrend. For tomorrow, this primary uptrend (white) would again be the only resistance to watch at 27,575-27,600 if there were a big rally. Meanwhile on a pullback, the first support will continue to be from its prior downtrend (blue) at 26,550-26,575. After that, its primary uptrend (white) and its next downtrend (orange) will both be supports at 26,300-26,350 where the 2 trends intersect.
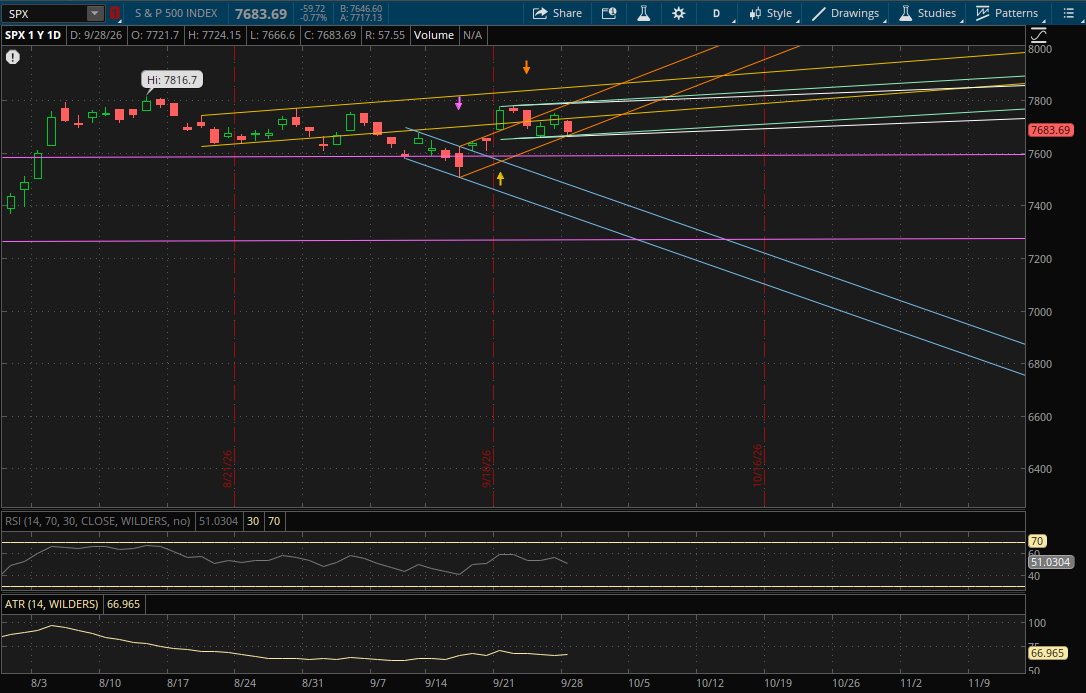
The S&P broke just below its previous primary sideways range (green) and closed back over it, giving it a failed breakdown (a weak one) which starts a new almost identical primary sideways range (white) for tomorrow. The first key level to watch tomorrow will be from its prior uptrend (orange) at about 7,688. This is just above today's close of 7,683.69. If it can gap above the 7,688 level, then that orange uptrend will act as support and the only other resistance to watch will be from its next uptrend (yellow) at about 7,737.
If the S&P fails to gap back above the first uptrend (orange) at 7,688 then this level will act as resistance on a rally attempt. From there on another pullback, the next support will be at about 7,672 on a retest of today's failed breakdown (green). If that retest doesn't hold, the next daily support will be just below it at about 7,668 from its new primary sideways range (white). If it breaks through both of those, or potentially even gaps below them, then the last daily support to watch for tomorrow will be from its big sideways range (purple) at 7,590-7,595.
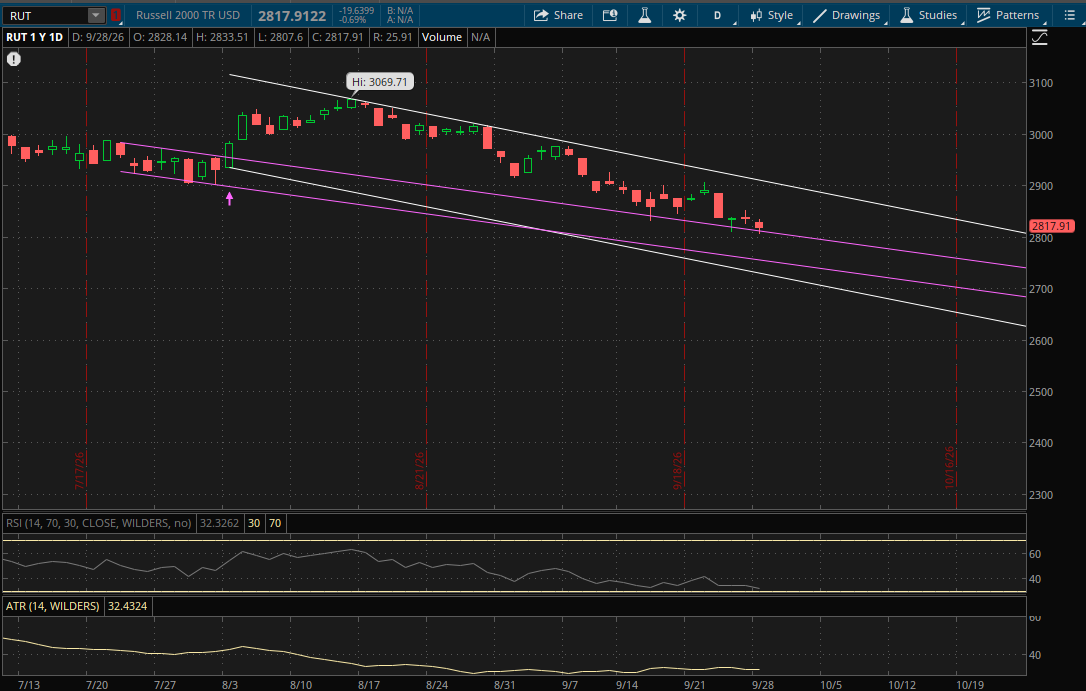
The Russell 2000 continues to trade within its big primary daily downtrend which it has been in since early August. Since it hasn't broken through it either way yet, it doesn't start any new ranges again. This primary downtrend (white) will again be the only resistance to watch at about 2,905 if we were to get a big rally tomorrow.
On a pullback, its prior downtrend (purple) will continue to be the first support at about 2,808. If it breaks through it, the next support will be from the bottom of this same range at 2,750-2,755. After that, the bottom of its primary downtrend (white) will be the last daily support to watch at about 2,725. Since its primary downtrend is pretty far away on both ends, it's likely that it just continues to trade within it for now.