The Nasdaq was the only index to finish higher this week as it hit new all time highs and posted a modest weekly gain of 0.40%. The S&P closed down 0.25% for the week while the Russell 2000 fell about 0.20%. While the S&P and Russell posted minor losses for the week, they were well off of the lows. The VIX on the other hand gained 3% for the week, but finished at the lows with the rally in markets on Friday. For next week there aren't many big market moving catalysts but we will get the FOMC minutes on Wednesday which may provide some insight into what Fed members see for interest rates going forward.
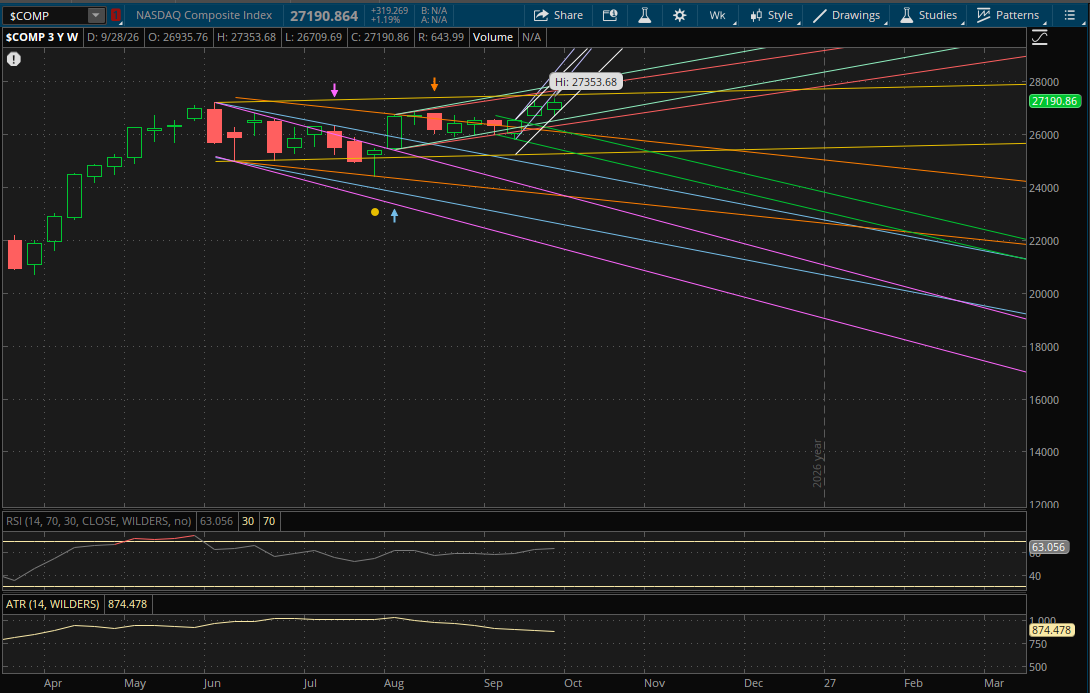
Looking at the weekly technical setup, the Nasdaq did open outside of last week's primary uptrend which was expected. It did make a higher high this week (a new all time high) so it still starts a new primary uptrend heading into next week. However, it has the same problem as last week which is that it's unlikely to open above its new primary uptrend (white) as that level will be around 27,475 which is about 1% away. If it can get this gap above this 27,475 level then its primary uptrend would act as support and it will have more resistance at about 27,500 from its prior sideways range (yellow). So this 27,475-27,500 area will be a big level to watch where these 2 trends intersect. If it can gap/break above the 27,500 area, then the next resistance will be around 27,775 (red). After that, the last resistance to watch would be around 27,975 (teal).
If the Nasdaq fails to get that gap above its primary uptrend (white) around 27,475 on Monday, which is the likely scenario, then this level and every other level mentioned above would be resistance. On a pullback, the first weekly support to watch would be from the bottom of its next uptrend (teal) at 26,650-26,675. If that doesn't hold, the bottom of its next uptrend (red) will be support at 26,425-26,450. The last support to watch after that will be at 26,000-26,050 from its next 2 downtrends (green and orange) where the 2 trends intersect.
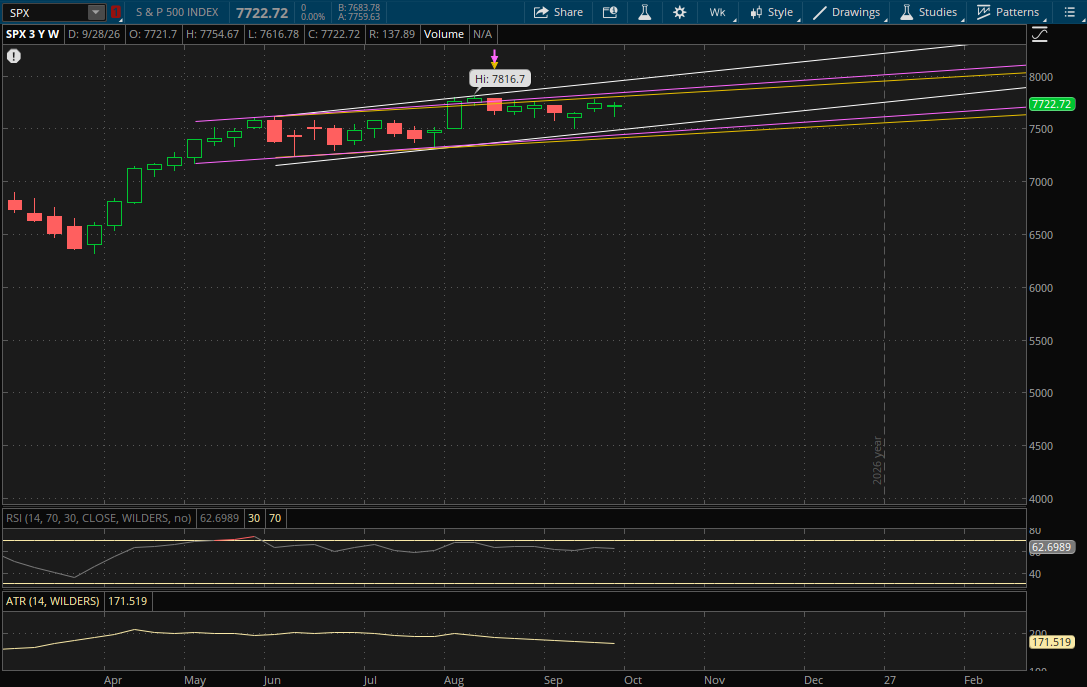
The S&P once again remained within the same weekly ranges that it has been trading in since May, including its primary uptrend (white), so it once again does not start any new weekly ranges for next week. The first resistance on a rally attempt will continue to be from its prior uptrend (yellow) at 7,815-7,820. If it breaks through it, its next uptrend (purple) will be resistance at 7,850. If it can break through both of these, its primary uptrend (white) will be the last weekly resistance to watch around 7,975.
On a pullback, the bottom of its primary uptrend (white) will be the first support to watch at 7,510-7,515. If that doesn't hold, the bottom of its next uptrend (purple) will be the next support at 7,455-7,460. The last weekly support will be just below that from the bottom of its next uptrend (yellow) at about 7,425.
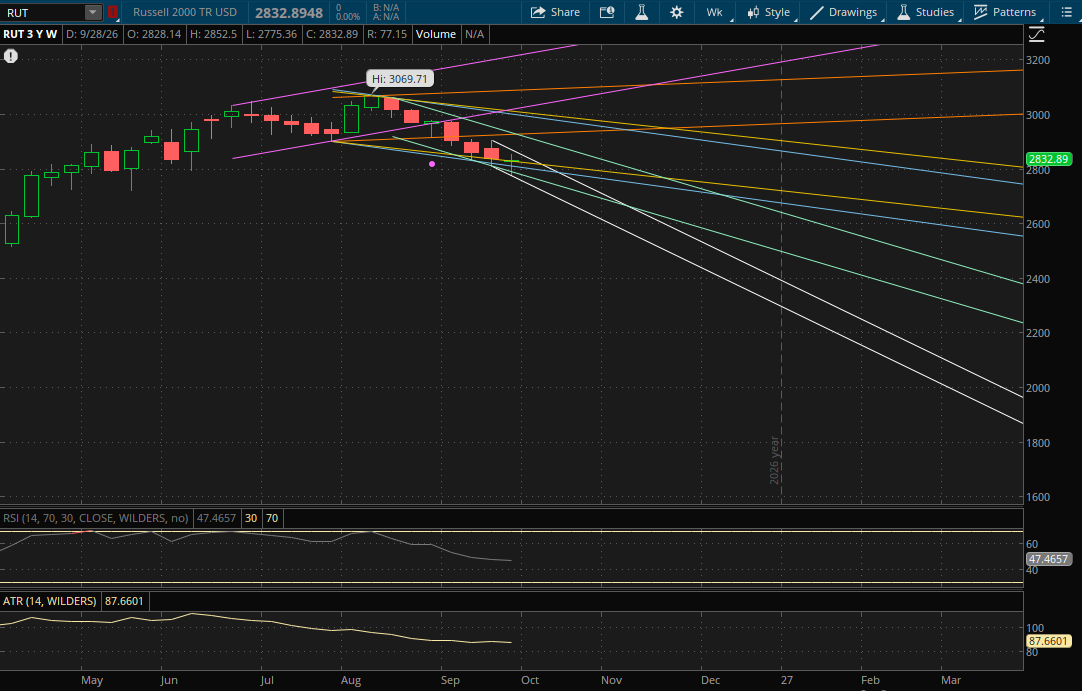
The Russell 2000 had another failed breakdown this week as it broke below last week's primary downtrend and rallied back to close above it. However, it made another lower low, so it starts a new primary downtrend again. This new primary downtrend (white) will be at about 2,835 next week which is just above this week's close of 2,832. So it could potentially gap above it, in which case this 2,835 area would then become support. If that happens, the next weekly resistance to watch would be from its prior downtrend (green) around 2,910. If it breaks through it, the last weekly resistance that likely comes into play would be from its previous uptrend (orange) at 2,930-2,935.
If it fails to open above its primary downtrend (white) around 2,835 on Monday, then this level will continue to act as resistance for now. On a continuation of the pullback, its next downtrend (yellow) will be the first support to watch at 2,822-2,823. This is also very close to this week's close of 2,832, so there's also risk of a gap below the 2,822-2,823 level. If that were to happen, this yellow trend would then become resistance rather than support. After that, the next support would be just above 2,800 (blue). If that doesn't hold, the bottom of its next downtrend (green) will be support at 2,767-2,768 which is just under this week's low of 2,775. Finally, the last weekly support to watch would be from the bottom of its new primary downtrend (white) at 2,740-2,745.