Markets finish higher, but close near lows
After last Friday's rout in the markets, they gapped up this morning with tech leading the way as the Nasdaq was up nearly 2% in the morning. However, the rally faded and the Nasdaq only closed up 0.86% which was close to the lows of the day for it. The Russell 2000 also closed higher by 0.77% but it was also just off of the lows of the day. The S&P only gained 0.3% and nearly went negative into the close. With the bounce back in the market today, the VIX did pull back to close down 12% after it jumped 40% on Friday. While markets did end up recovering some of those losses from Friday, it wasn't a strong finish at all.
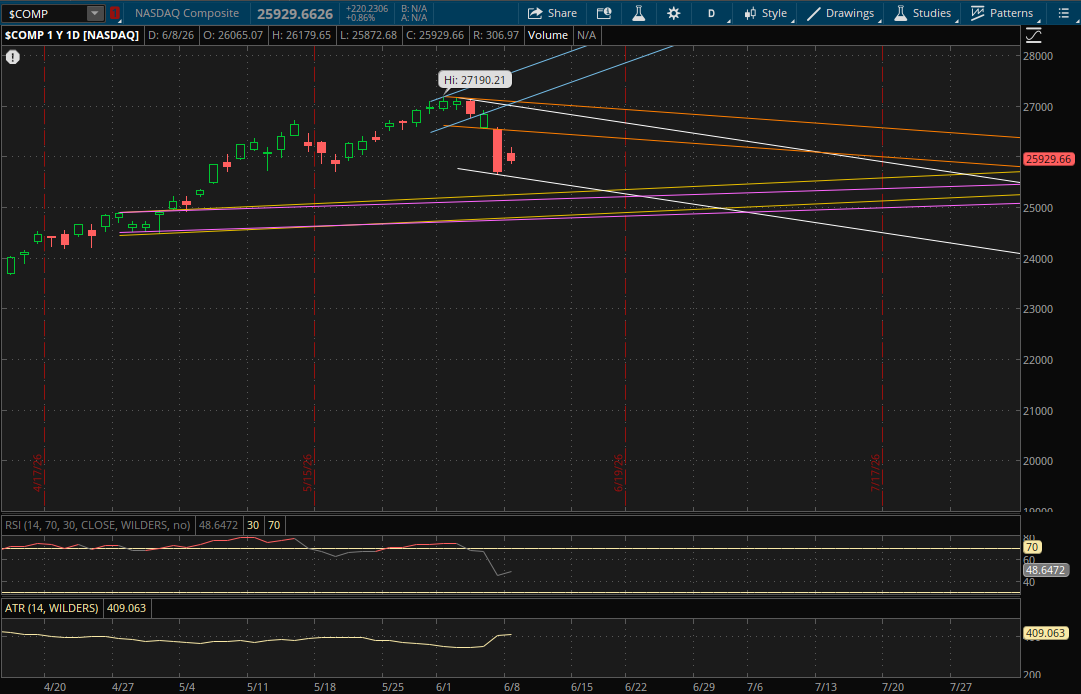
This was an inside day for the markets and none of the indexes broke through any prior trends, so none of them start any new ones for tomorrow. For the Nasdaq, its primary downtrend (white) will again be the first support level to watch at about 25,570 tomorrow. If that doesn't hold on a continued pullback, the next support will be from its prior uptrend (yellow) at about 25,260 and then its last support (purple) will be at about 25,150.
If we get another bounce tomorrow, the only resistance that will likely be in play is from its prior downtrend (orange) right around 26,500.
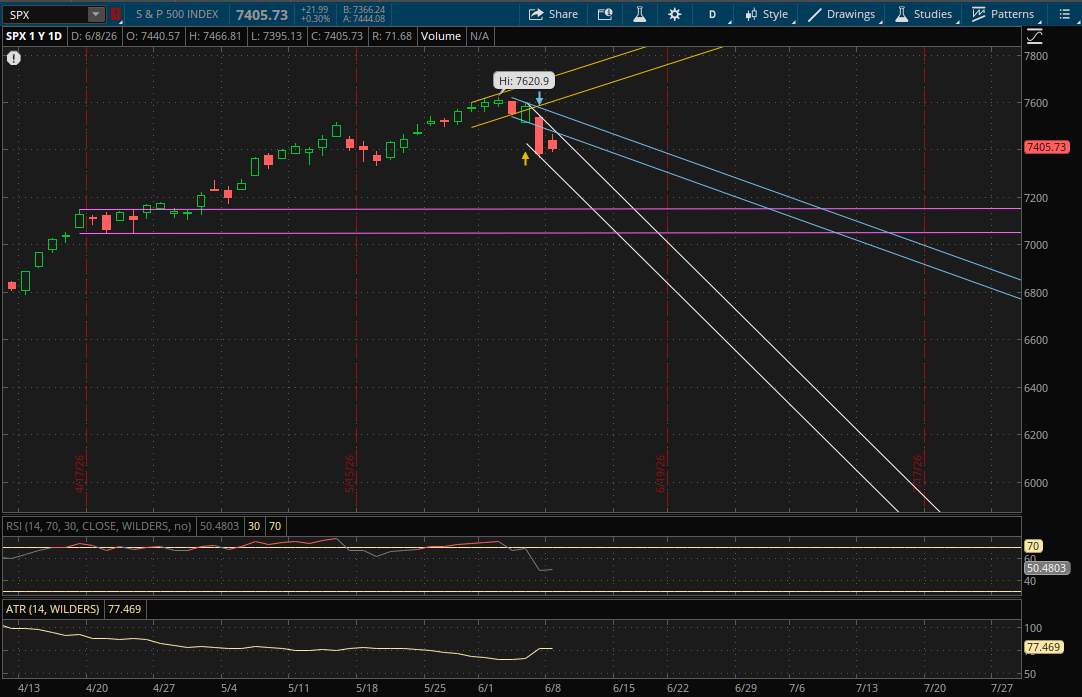
The S&P got rejected near its first resistance this morning from its prior downtrend (blue) that I mentioned in the prior update. For tomorrow the first resistance will now be at its primary downtrend (white) around 7,427. If it can break through it, then its prior downtrend (blue) would be the next resistance at about 7,455.
If the pullback continues, the only support likely to be in play will be from its primary downtrend (white) at about 7,255.
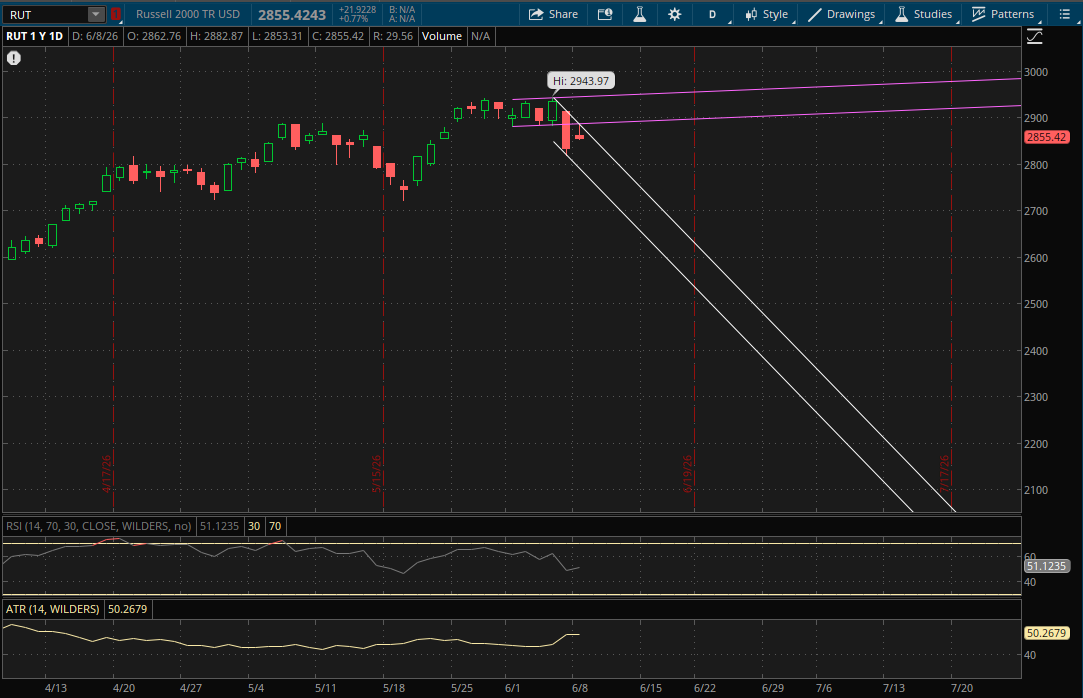
The Russell 2000 got rejected right at its primary downtrend around 2,883 today as it put in a high of 2,882.87 before the afternoon fade. Since it didn't break through it, its primary downtrend (white) will again be the first level to watch tomorrow at 2,853-2,854. Now this is just below today's close of 2,855.42. So if the Russell 2000 can open higher tomorrow, or at least flat, then it will open above this downtrend and the 2,853-2,854 level will act as support on a retest. From there, the only other resistance on another rally attempt will be at about 2,888 from its prior uptrend (purple).
If the Russell fails to open above its primary downtrend at 2,853-2,854 tomorrow then it will continue to act as resistance on a rally attempt. On a continued pullback its only other daily support will also be from this same downtrend at about 2,758.