Economic data in focus after Fed holds rates steady
The markets finished lower in July with the Nasdaq and Russel 2000 both closing lower by just over 3%. This was back-to-back monthly losses for the Nasdaq, falling as much as 10% from its all time high in June. The S&P on the other hand essentially finished flat with the end of week rally back to finish out the month. The Fed decided to keep rates unchanged this week and wait for more economic data. There won't be another rate decision until September 16th, so the Fed will have a lot of economic data over the next six weeks to consider. This week we will get the July employment situation data which I talked about in the weekly update, and then on August 12th we will get CPI which will be the biggest event after the jobs report. Kevin Warsh will also be participating in the Jackson Hole Economic Symposium where investors will focus on his remarks about the policy outlook.
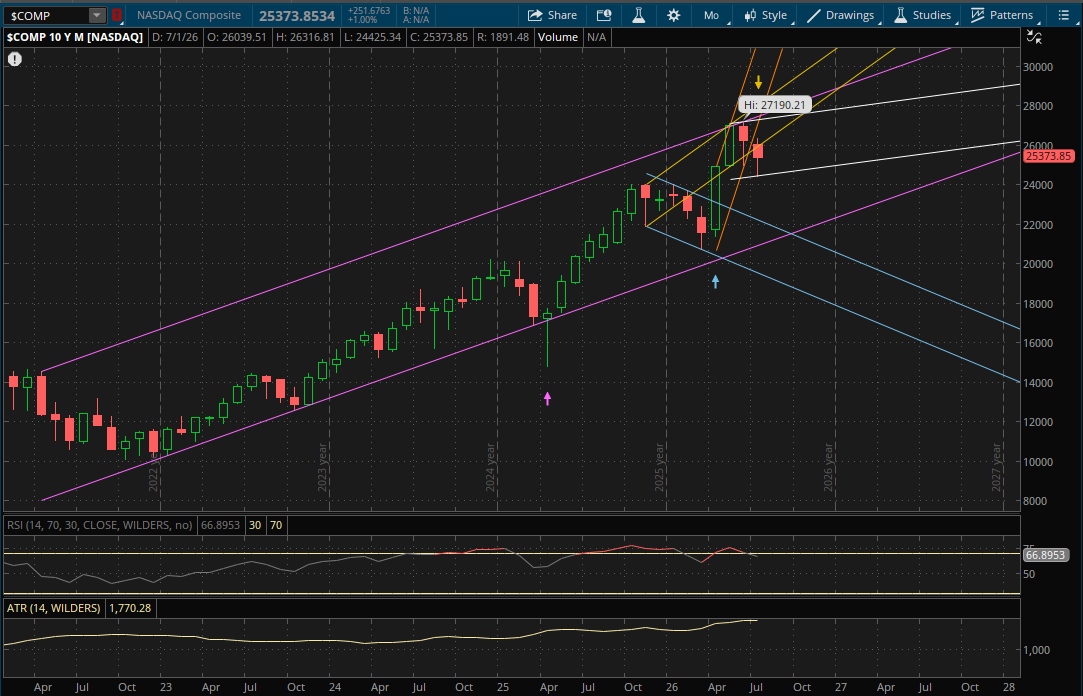
In the last two monthly updates I've been noting an increased likelihood of a market pullback as the technicals were beginning to break down. This continued last month as the Nasdaq broke and closed below its last monthly uptrend, which now starts a new sideways range for it. Its already at the bottom of this new monthly range, so there is room to rally back here in August. For now the next resistance to watch on another rally attempt will be from its prior uptrend (yellow) at about 26,500. If it can break through it, the next monthly resistance will be from its new primary range (white) around 27,400 which would be new all time highs for it. If it can also break through this resistance, the last monthly resistance potentially in play would be from its long term uptrend (purple) around 27,700.
If there is another sell-off, the first support to watch would be from its new primary range (white) at 24,500-24,550. If this area doesn't hold, its next monthly support is pretty far away from its prior downtrend (blue) around 21,900 and the last monthly support would be from its long term uptrend (purple) at 21,150-21,200 in the event of a big sell-off.
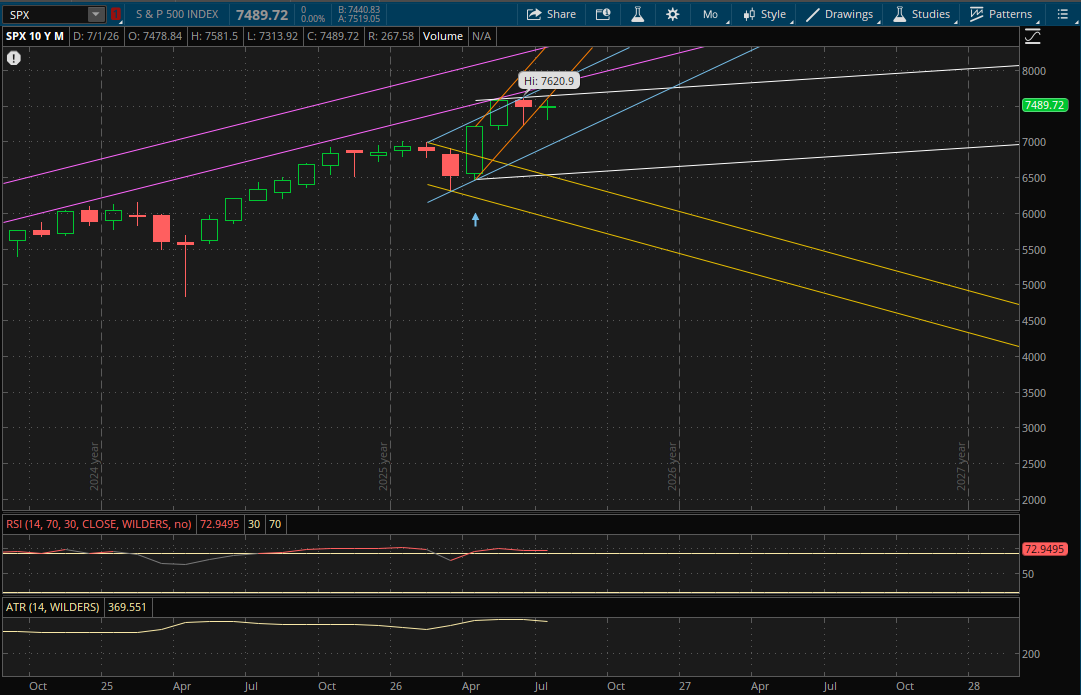
The S&P also broke and closed below its previous monthly uptrend support, starting a similar sideways range for it as the Nasdaq. However, it was a much stronger finish for the S&P, and because there was no follow through on this months break down it bodes well for the market rally to resume for now at least.
The first resistance to watch for the S&P will be from its new primary range (white) at 7,665-7,670. If that breaks through, its next monthly resistance will be from its prior long term uptrend (purple) which it never invalidated. That resistance will be around 7,875. After that it will have two more monthly resistances from its next two uptrends (blue and orange) at about 7,950 and 8,000.
If there is another sell-off, the first support to watch will be from its prior uptrend (blue) at about 7,110. If that doesn't hold, its primary range (white) would be the next support at 6,560-6,570 and the last support would be from its prior downtrend (yellow) around 6,440.
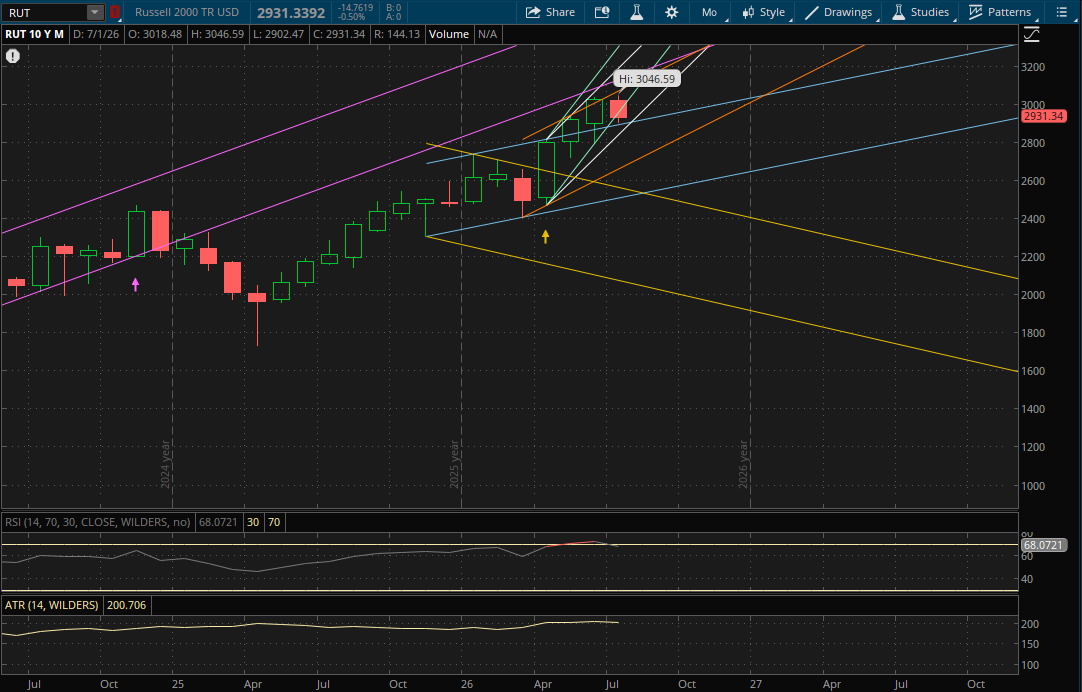
The Russell 2000 looks most at risk right now as it broke and closed below last months primary uptrend support and it was a weak finish for the month. It does still start a new primary uptrend (white), but it will need to gap up on Monday to open above it as that level will be at 2,970-2,975 which is almost 1.5% above Friday's close of 2,931. Unless it can get this gap up on Monday, the 2,970-2,975 level will act as resistance on a rally attempt. If it can get that gap above it, or if it opens below it but breaks through it, then the next monthly resistance in play would be at 3,130-3,140 from its next two uptrends (teal and orange) where they both intersect.
It is possible we get a rotation out of small caps and into the rest of the markets again if yields continue to rise and weigh on the Russell 2000. Assuming there is no gap above the 2,970-2,975 level on Monday, the next support to watch on a pullback will be from its prior uptrend (blue) at about 2,920. There is risk of a gap below this 2,920 support on Monday as it is only 0.3% away from Friday's close. If that were to happen, then this 2,920 area would also become resistance and it would increase the chances of a larger pullback. The next support to watch after that would be at 2,725-2,730 from its next uptrend (orange). If that doesn't hold either, the last monthly support to watch would be at 2,530-2,540 from both its prior downtrend (yellow) and uptrend (blue) where the two intersect.