Markets snap 3 week winning streak ahead of Nvidia and Jackson Hole
In last week's update I noted that it was likely that we would get a pullback as the markets would not gap up enough to open above its primary uptrend supports. We did get this pullback as expected with the Nasdaq leading the way lower, posting a weekly loss of about 2%. The S&P fell about 1.4% for the week after hitting new all time highs last week and both the Nasdaq and S&P snapped their 3 week winning streaks. The Russell 2000 also fell about 1.6% as the Treasury Department's attempt to bring yields down failed - so far at least. Despite the pullback in markets this week the VIX didn't do too much as it gained about 6% for the week but finished near the lows.
Next week there will be a few big catalysts to watch for in markets. The first will be PCE (personal consumption expenditures) data on Wednesday before the market opens. This is the Fed's preferred inflation gauge and it will likely move odds of future rate decisions as well. Then after the market close on Wednesday we will get Nvidia's earnings report. Their report will likely move the markets as it remains the largest weighting in the Nasdaq 100 and it will also effect the semiconductor sector broadly. Finally on Friday we will get Fed chair Kevin Warsh's speech at the Jackson Hole Economic Policy Symposium. Historically the event at Jackson Hole has provided some volatility for markets.
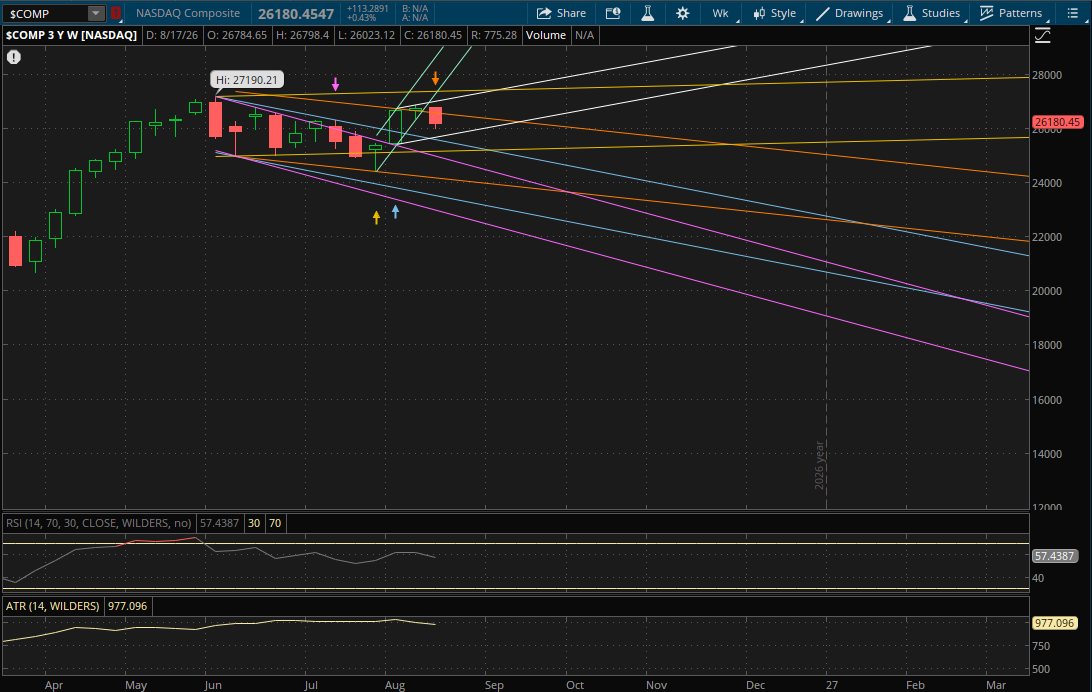
Looking at the technical setup now for next week - there was some damage done with this week's pullback. The Nasdaq closed below its prior primary uptrend and it was a weak finish near the lows of week. For now though it does still start a new primary weekly uptrend (white). If we get a rally next week, the first resistance to watch will be from its prior downtrend (orange) which it broke significantly below this week. That will now be resistance around 26,500 on a rally attempt. Its only other weekly resistance will be from its new primary uptrend (white) around 27,150 if we were to get a big rally back near all time highs.
On a continuation of the pullback, the first support to watch will be from its new primary uptrend (white) at 25,825-25,850. If this doesn't hold, its next support will be from its prior downtrend (blue) around 25,440. After that its prior sideways range (yellow) will be support around 25,175 and then the last weekly support to potentially come into play on a big sell-off will be around 24,775 from its prior downtrend (purple).
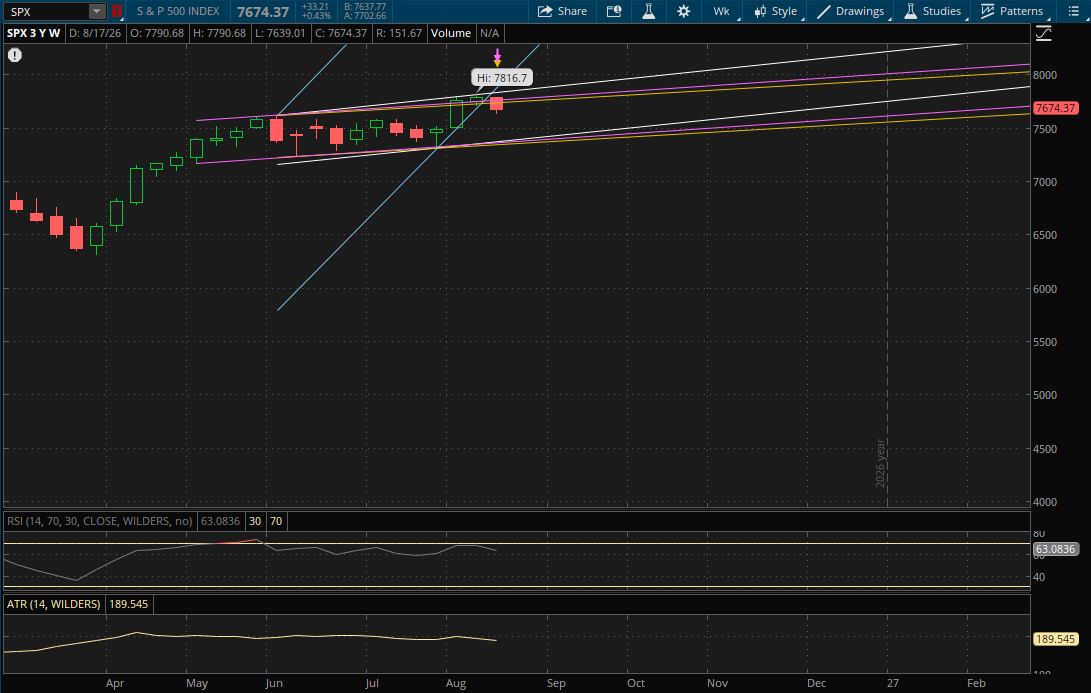
The S&P had the most notable breakdown this week. It also failed to get the gap up on Monday above its primary uptrend which led to this pullback. Not only that, but it had a significant breakdown below both of its prior uptrends (purple and yellow). This in my opinion was quite bearish and will lead to further near term downside. With this breakdown it did still start a new primary weekly uptrend, however it's not a strong uptrend and its a pretty wide range and there is further room to pull back in it.
First let's look at resistances. The first resistance to watch on a potential retest of this week's breakdown will be from its prior uptrend (yellow) at about 7,750. If it does break through it, the next uptrend (purple) will be resistance at 7,770-7,775. The final resistance would be from its new primary uptrend (white) around 7,855, however I don't think we'll see this level actually get tested given the breakdown this week.
On a continuation of the pullback, which I believe to be the more likely scenario, the first support support to watch will be just under 7,400 (around 7,395) from its new primary uptrend (white). This would be where it's at for next week which is about 3.5% away. Given the catalysts we have next week I think it is possible that we can get there that quickly. After this 7,395-7,400 area from its primary uptrend, the next 2 supports to watch will be from its previous uptrends that it broke down through this week (purple and yellow). Those will still be supports from the bottom end of the ranges at 7,375-7,380 (purple) and 7,355-7,360 (yellow). If this scenario does play out and we pull back towards 7,400 I would be interested in buying the dip.
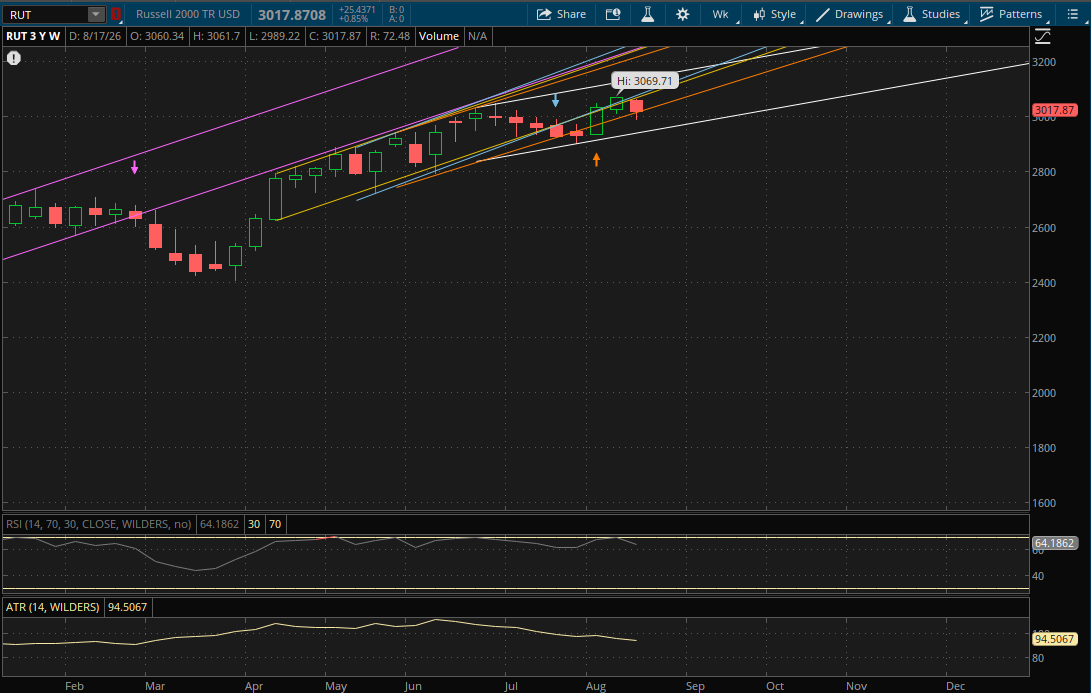
The Russell 2000 also broke down a bit this week below its prior uptrends and so those will now act as resistance on a rally attempt. It didn't break through its primary uptrend so it doesn't start any new weekly ranges. The first resistance to watch will be at its first uptrend (orange) at 3,039-3,040 on a rally attempt. The Russell closed at 3,017 so this is about 0.75% away. As long as there's no big gap up on Monday above the 3,040 area then it will continue to act as resistance. If it does gap or break through it, the last 2 resistances to watch would be at 3,095 (yellow) and 3,105 (blue) which would be new all time highs for it.
On a continuation of the pullback, which again I believe is the more likely scenario, its primary uptrend (white) will be the only weekly support level to watch. That will be support at about 2,955 which is only about 2% away. Considering I expect more downside in the S&P, I would expect this 2,955 area to break on the Russell 2000 if the bearish scenario does in fact play out. If that does happen, it will start a new primary weekly trend but we'll first have to wait and see how it finishes to determine the direction of the new trend.