Small caps led the markets lower this week as the Russell 2000 lost 4% while the S&P lost 2%. The Nasdaq only lost 1.2% as software rebounded with IGV closing up nearly 8% for the week, softening the blow for tech. With the continued sell-off in markets and turmoil in the Middle East, the VIX closed up 48% for the week. This was the biggest one week gain for the VIX since March of 2025 during the Trump tariff sell-off. Next week, aside from rising oil prices and the geopolitical tensions, the market will be focused on Wednesday's CPI report. Headline and Core month-over-month are both expected to increase by 0.3%.
I've mentioned in previous updates that the odds of the next rate cut have been getting pushed back due to increasing inflation fears from rising oil and gas prices. A month ago the market was pricing in the next rate cut for the June 17th meeting which got pushed back to the July 29th meeting a couple of weeks ago. Now the next rate cut is being priced in for the September 16th meeting. However, one important thing to consider is that Jerome Powell's term as Chair of the Federal Reserve ends on May 15th and Kevin Warsh has officially been nominated by President Trump as the next Chair.
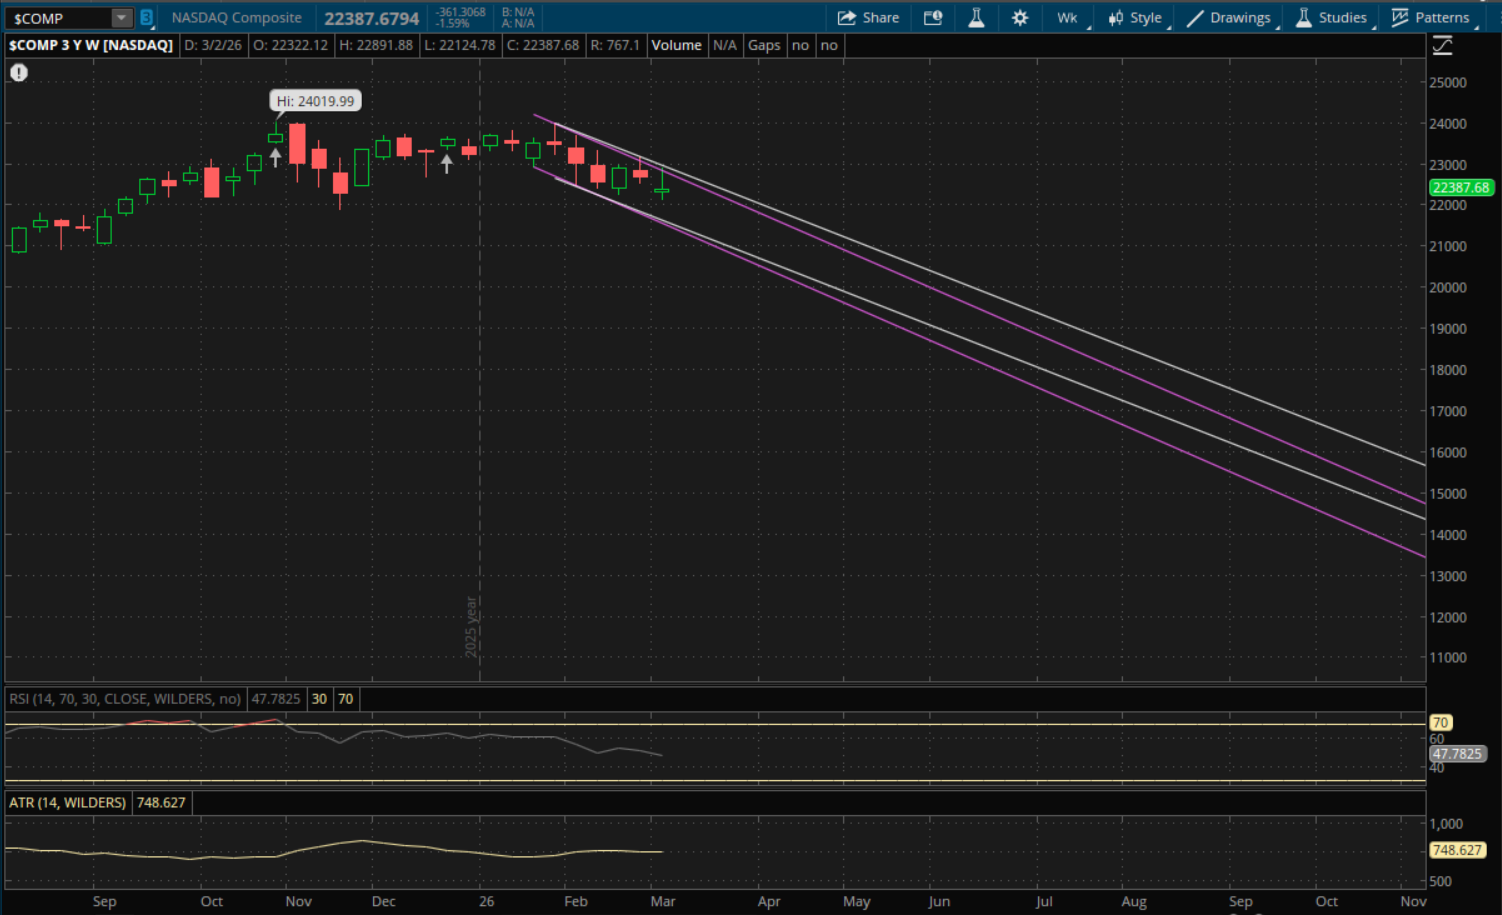
In last week's update I noted that the Nasdaq put in a failed weekly breakout and that the 22,850 area was the ideal spot to short on a bounce. This level was almost the perfect spot as the high of the week was 22,891, just 0.18% away. It did not break through its new, primary downtrend (white), so no new trends get started for next week. The first resistance for next week to watch will be from its prior downtrend (purple) at about 22,615 while its primary downtrend (white) will be at 22,760. On a continued sell-off the next weekly support will also be from its primary downtrend at about 21,440 with its prior downtrend being support at 21,325. However, it will also have monthly support before both of these at about 21,925.
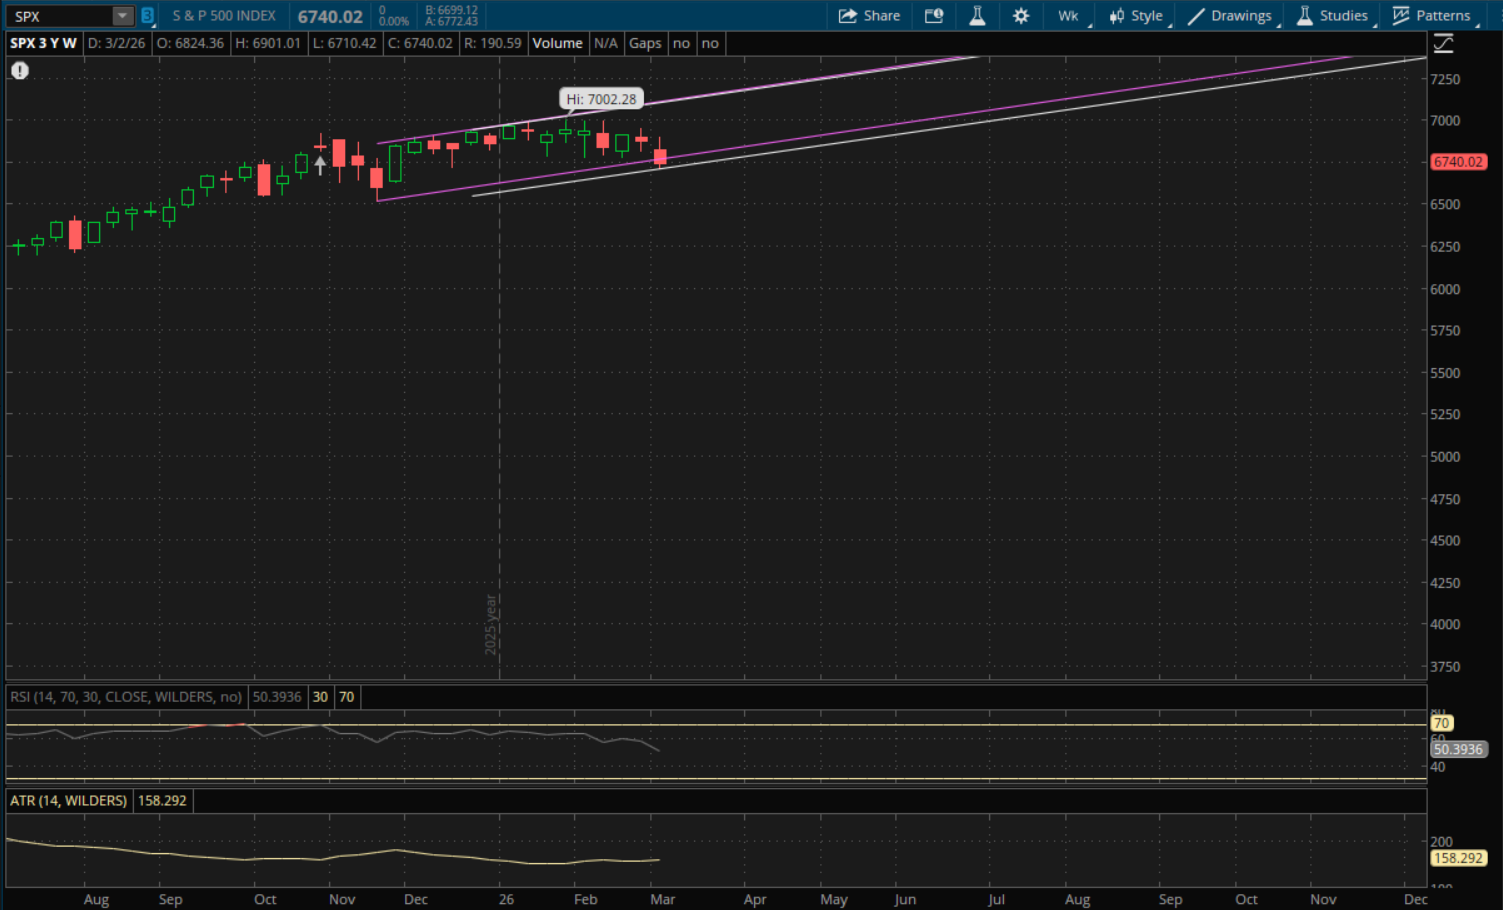
The S&P finally broke and closed below its prior weekly uptrend that it had been in since November. This now still starts a new uptrend for it, but there is risk of a gap below it on Monday since it wasn't a strong finish this week. Its new primary support (white) will be 6,727-6,728 which it closed just above on Friday (6,740). If it does open above it, then it will act as support on a pullback and the next resistance level to watch will be from its prior uptrend (purple) that it closed below on Friday. This will now be resistance at about 6,785-6,790 on a bounce. If it gaps below the new primary support at 6,740 then this level would be resistance on a bounce and we would need to see how it closes for the next trend.
There is a potential scenario where we see a gap up on Monday above the 6,785-6,790 level which is that prior uptrend (purple). If that were to happen, it would likely be a bottom signal for the markets and I would be looking to buy the dip - especially if it were to pullback closer to the new uptrend support (white).
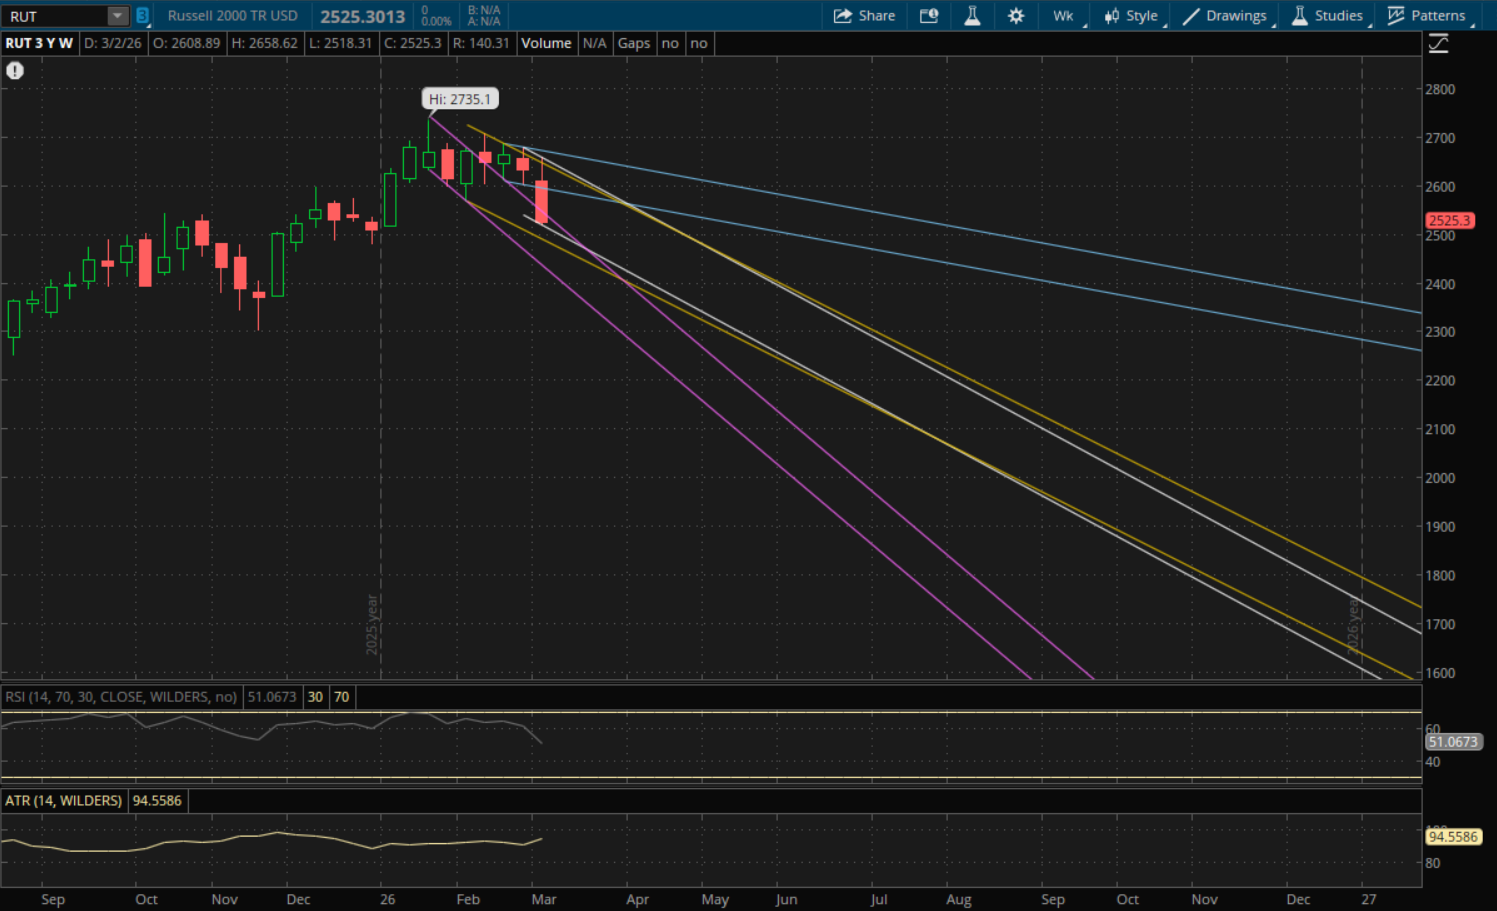
The Russell 2000 broke well below its prior weekly uptrend support and starts a new downtrend going into next week. The first support to watch will be from its prior downtrend (purple) at about 2,511 and its new downtrend (white) will be at about 2,496. This is also about where daily support will be for Monday (see my daily update). If neither of these levels hold, the next weekly support will be at 2,470 from its prior downtrend (yellow) and if we see another big sell-off its prior (purple) downtrend comes into play again just above 2,400.
On a bounce the first resistance level to watch will be from its prior downtrend (blue) at about 2,585-2,587. If it can clear through that area then its next downtrend resistance (yellow) will be at about 2,627 followed by its new, primary downtrend (white), at about 2,637. If it breaks through this level as well, its prior downtrend (blue) comes into play again at the top of the range which will be at about 2,665.