There was another sharp sell-off yesterday in the markets after the February Employment Situation report disappointed. Nonfarm payrolls fell by 92,000 with expectations that there would be 50,000-60,000 jobs added. The unemployment rate also rose to 4.4% while it was expected to remain unchanged at 4.3%. On top of the weak jobs report, oil continued to spike as it topped $90 a barrel on the ongoing tensions in the Middle East. Oil reached a high of $92.61 yesterday, jumping 37% for the week which was its largest one week gain in history. This is also the highest oil has been since September of 2023, increasing inflation fears. With yesterday's sell-off the VIX spiked again, closing up 24% as it almost hit $30. This is the highest the VIX has been since last April during the market sell-off from the Trump tariffs.
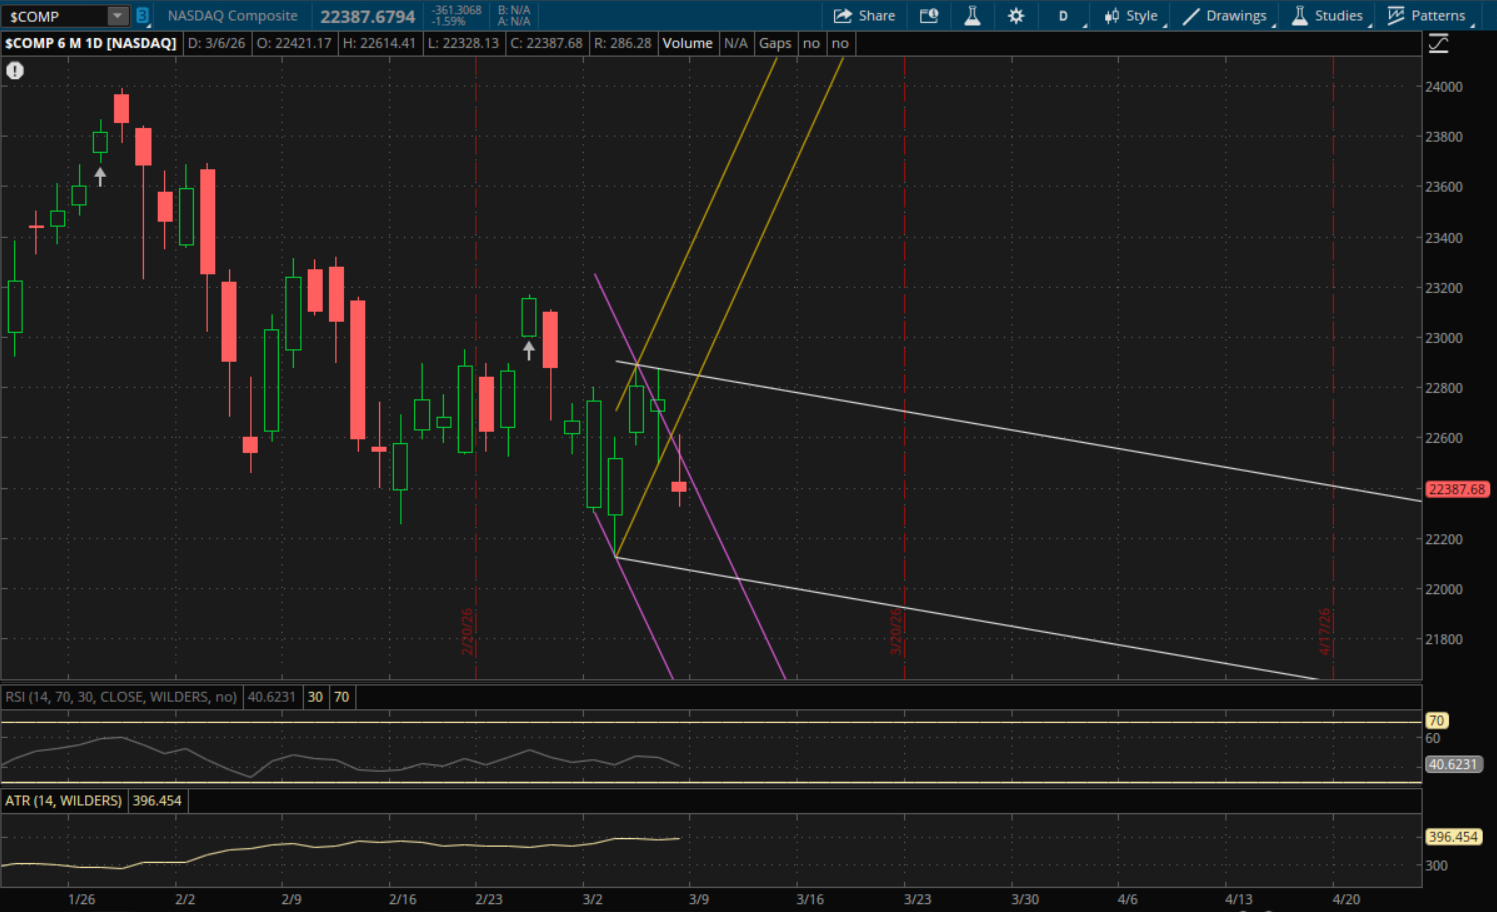
Looking at levels for Monday, the Nasdaq broke and closed below its prior uptrend support and now starts a new daily downtrend. Its prior downtrend (purple) will be the first level to watch which will be at about 22,340 for Monday. The Nasdaq closed at 22,387 yesterday, so it's currently above it. But with the current volatility in markets it could very easily open below this level in which case it will be resistance. If it does open above the 22,340 level then it will act as support on a pullback. The next resistance level on a rally would then be at about 22,850 from its new primary downtrend (white). Its prior uptrend (yellow) would also be resistance just above that at about 22,880.
If the Nasdaq gaps below its prior downtrend (purple) at the 22,340 area then this level will be resistance on a bounce. The next support to watch would then be at about 22,065 from its new downtrend (white). Monthly support (see the monthly update) would then be the next big level to watch which is at about 21,925.
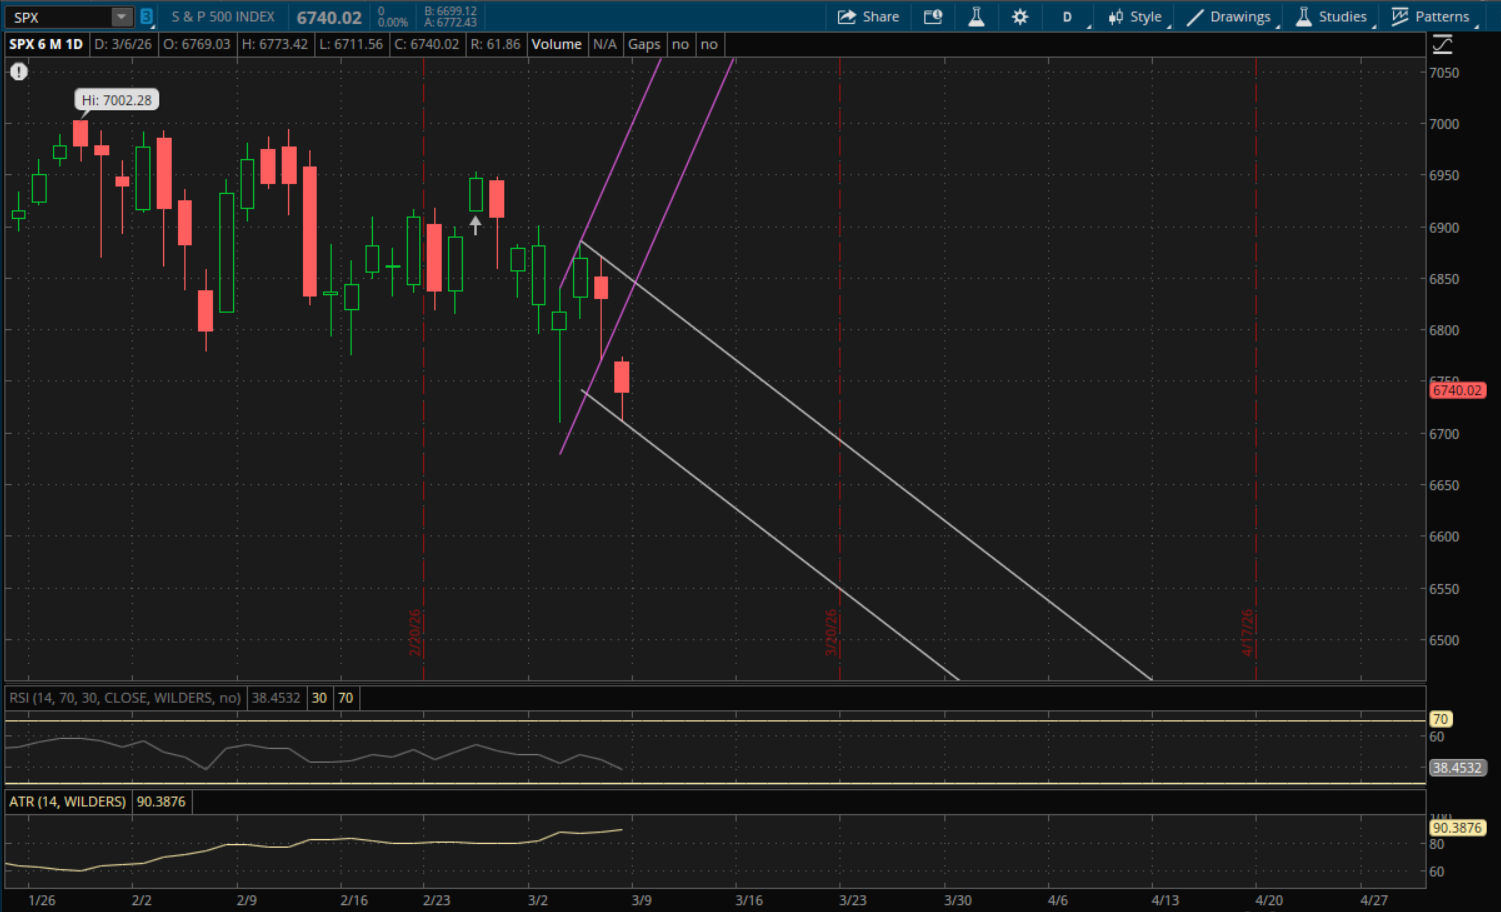
The S&P also started a new downtrend yesterday after it broke and closed below its prior uptrend support. The difference here is that it's already at the bottom of this new range. But it can still go lower to test the support again on Monday which will be at about 6,695. It closed at 6,740 yesterday and there is still risk of a gap below this 6,695 level on Monday due to the elevated volatility. If that happens, then 6,695 will become resistance on a bounce. On a rally attempt the next resistance to watch would also be from this new downtrend (white) at about 6,840 with more resistance from its prior uptrend (purple) at about 6,860-6,865.
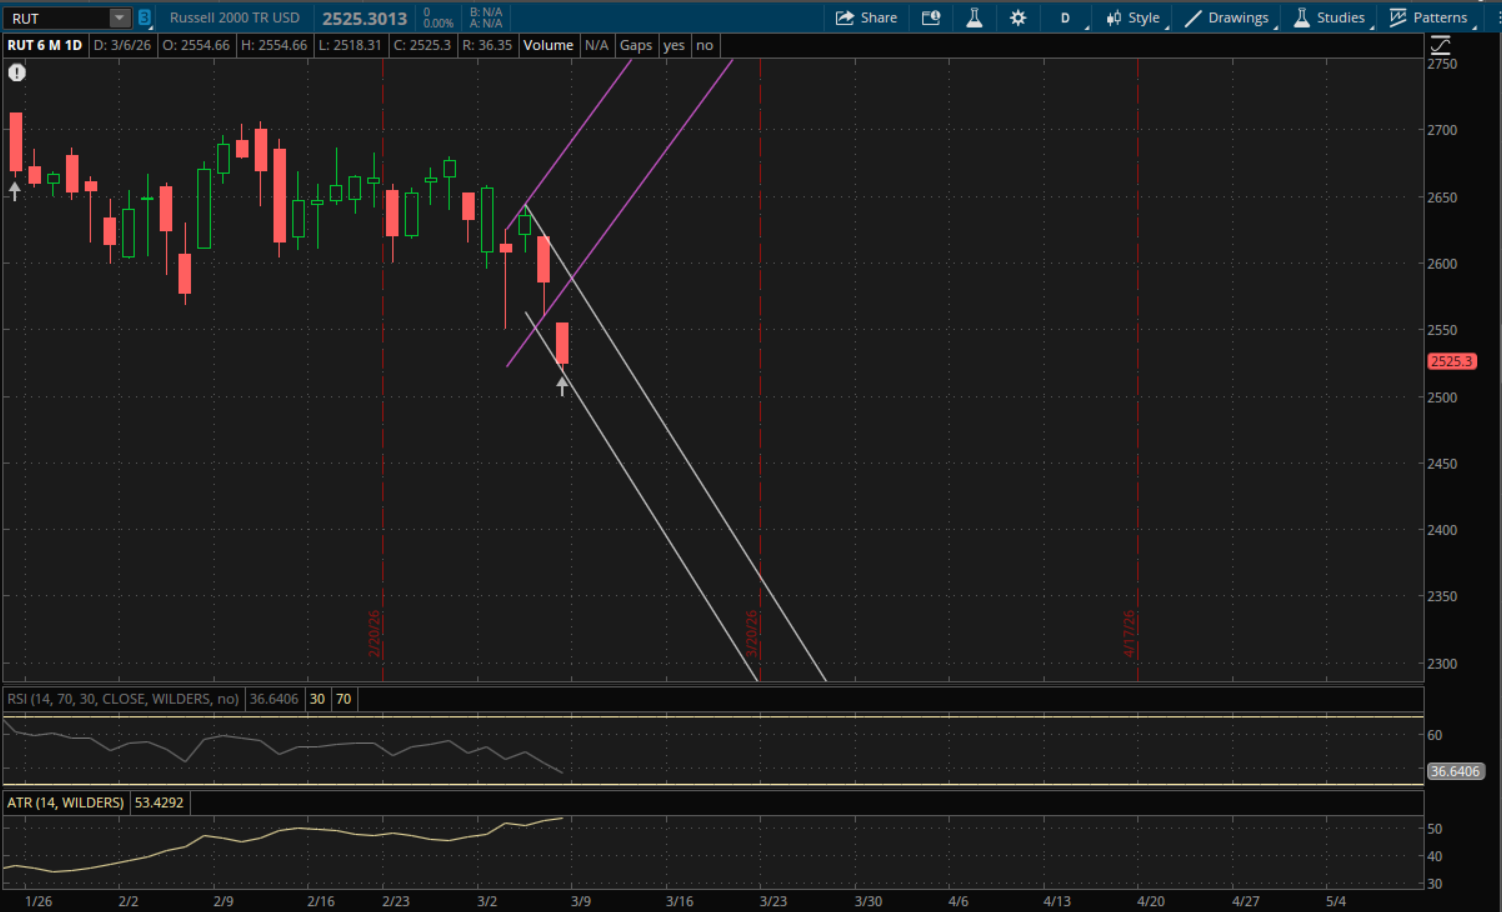
The Russell 2000 is similar to the S&P as it started a new downtrend and is already at the bottom of the new range, but it was a much weaker finish than the S&P as it closed near the lows of the day yesterday. Its new daily downtrend support (white) will be support at about 2,495. This is also about where weekly support will be at (see the weekly update) so this will be a major level to watch early in the week. If we get a bounce, the first resistance to watch will also be from this new downtrend at about 2,575. After that its prior uptrend (purple) would also be resistance at 2,600.