The markets continued their decline this week and the S&P has now had 5 down weeks in a row which is its longest weekly losing streak since the 2022 bear market. However, unlike the Nasdaq and Russell 2000, it has not quite yet reached correction territory as it is down 9% from its all time highs - just shy of the 10% mark which we may get to next week. The Nasdaq did enter that correction territory this week as it lost another 3.2% and is now down 12.8% from its all time highs. The Russell 2000 actually led all week and closed slightly higher with a gain of 0.47%, although it was still a weak finish as it closed near the lows of the week after having been up as much as 4.4%.
Next week is a short holiday trading week with the markets closed on Friday, April 3rd, for Good Friday. The March employment situation report will be released Friday morning while the markets are closed. This is going to be the biggest data for the week as we'll get Nonfarm payrolls data and the unemployment rate for March. Jerome Powell will also be speaking on Monday, March 30th, at Harvard University in a moderated discussion and he may speak on the economy so this could be market moving.
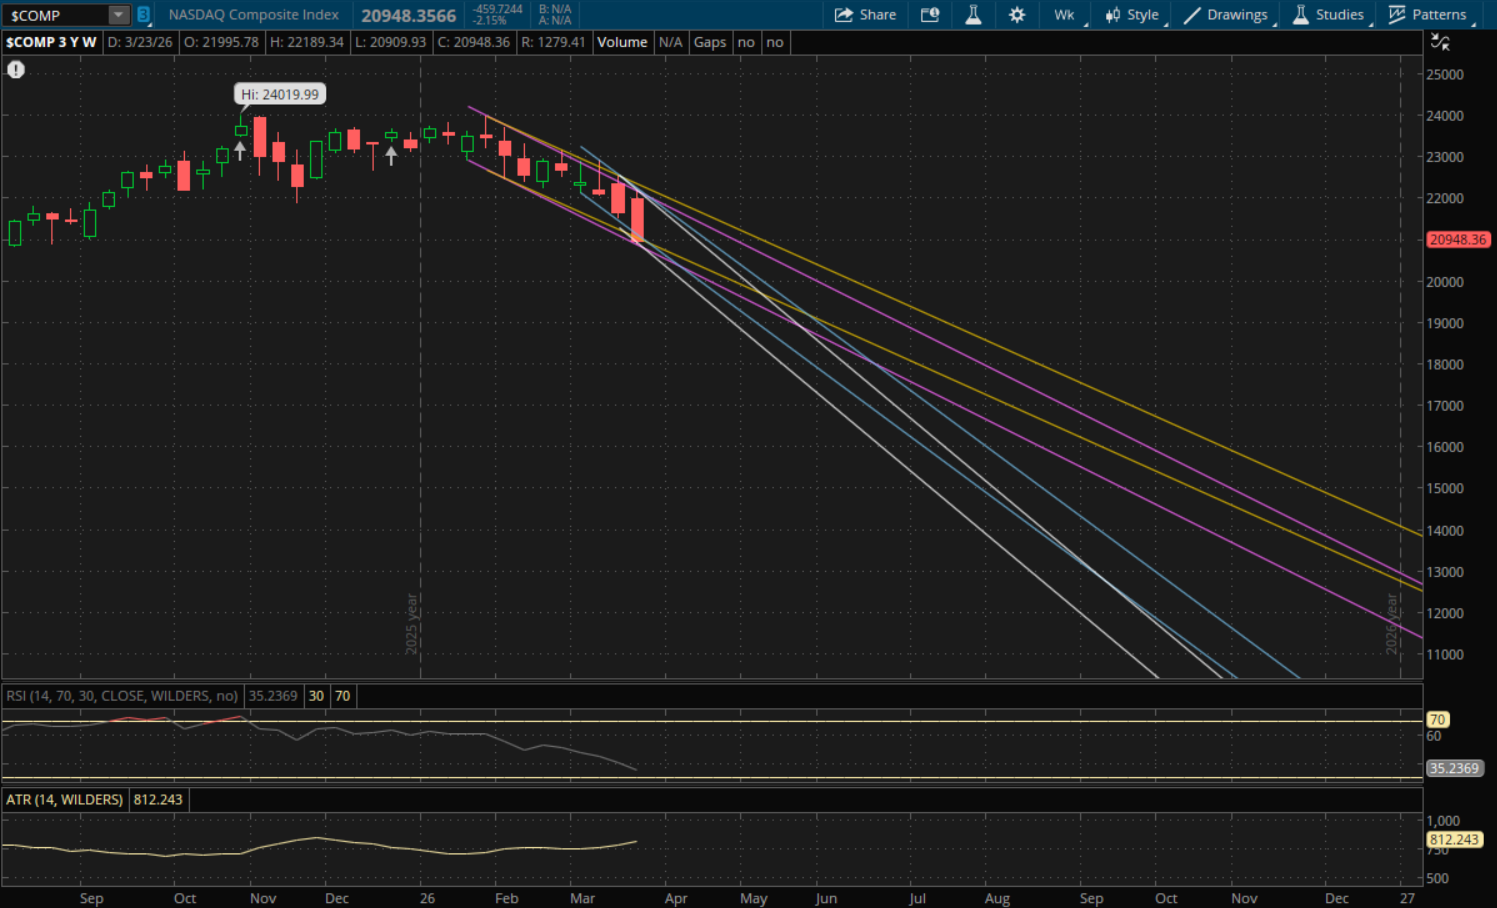
The Nasdaq initially traded between its first weekly support and resistance levels in the first half of the week, but ended up breaking down into the end of the week as the sell-off intensified. It broke and closed below its primary support as well which starts a new downtrend for it this week. But, there is a silver lining here which is that all of its supports for next week are below Friday's closing price. So as long as there's no big gap down on Monday, there is room to get a rally going next week.
The first support to watch next week will be its prior downtrend (yellow) at 20,820-20,825. The Nasdaq finished this week at 20,948 so it's about 0.6% above this first support. It can still test it, but it needs to not gap below it. If it does open above it on Monday I will be interested in buying the dip for a short term bounce trade. Its next downtrend support (blue) will be at 20,775 followed by its next prior downtrend (purple) at 20,640. If none of these hold, then its last downtrend support will be its new primary downtrend (white) at 20,525.
If we do get this bounce back next week, the first resistance to watch will be from its primary downtrend right around 21,800. After that, its prior downtrends come into play at about 21,900 (blue), 21,940 (purple) and lastly 22,150 (yellow). If it does break through the first resistance (primary downtrend) then it will start a new trend, but we'll have to see how it closes for the next trend. There are also only 2 trading days left in March, so the first half of this week will help determine monthly levels for April which I'll update on Tuesday night.
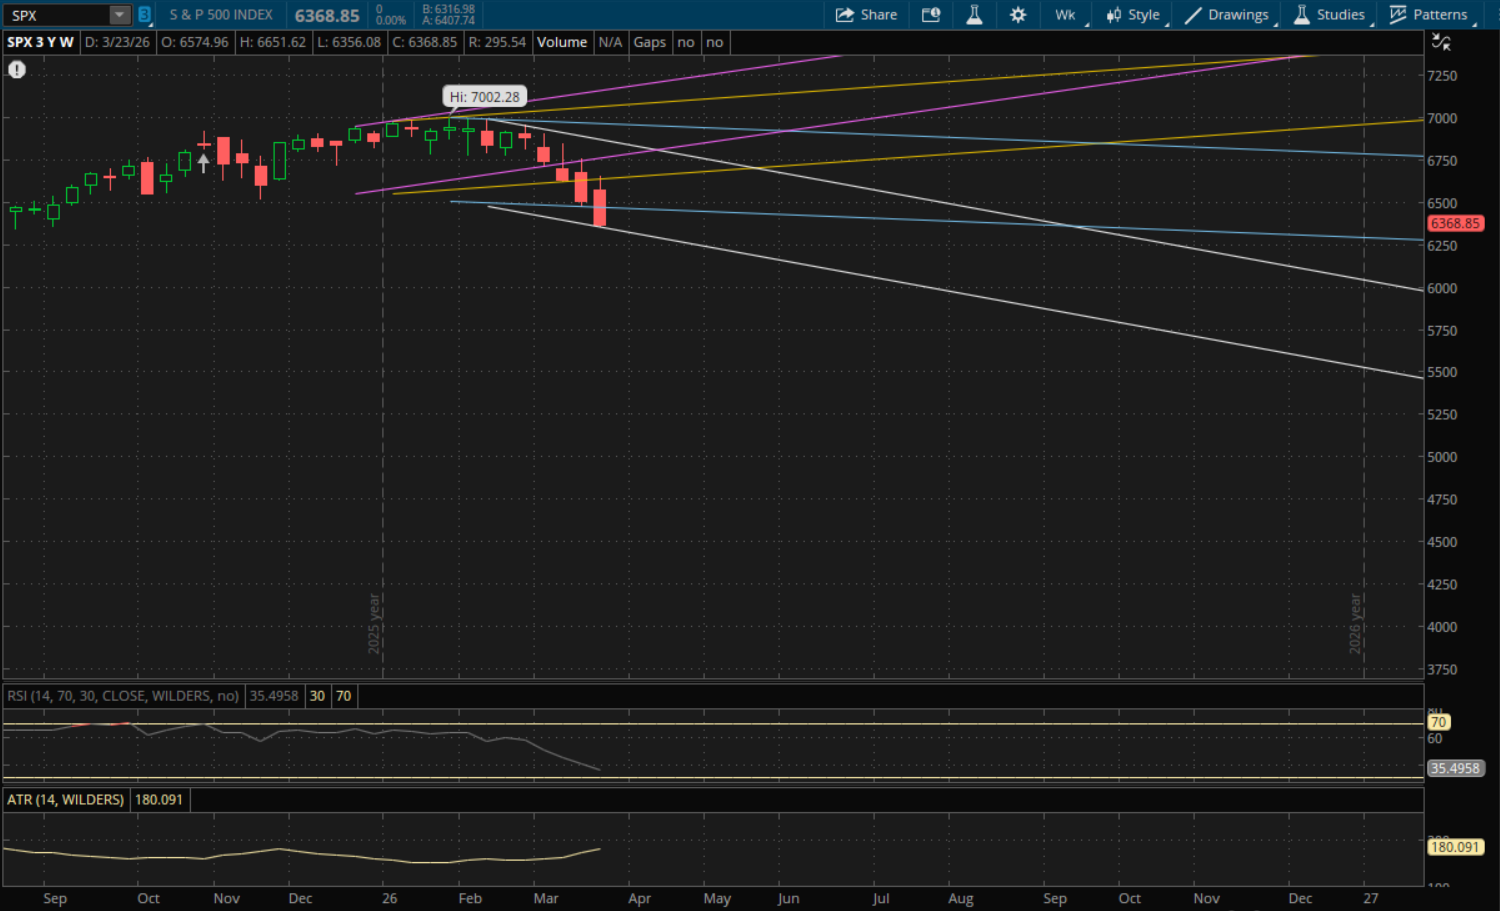
The S&P closed below last week's primary downtrend as well and now it also starts a new downtrend for next week. Its new primary downtrend (white) support will be at 6,335 for next week and this is the only support level to watch right now. If it breaks through it, we'll need to see how it finishes the week for he next trend. Similar to the Nasdaq, it closed above this level on Friday at 6,368.85. So as long as it doesn't gap below 6,335, which is about 0.50% away, then it will act as support if it's tested.
On a rally attempt, its first resistance will be from last week's downtrend (blue) that it closed below which will be at 6,465. If it can clear through this level, then the next resistance will be from its prior uptrend (yellow) at 6,650. After that, its next uptrend (purple) would be resistance at 6,775 and then its primary downtrend (white) that it started this week comes back into play at the top of the range at 6,850. However, these last two levels are pretty far away and it would require a big rally next week to reach those which may not be realistic.
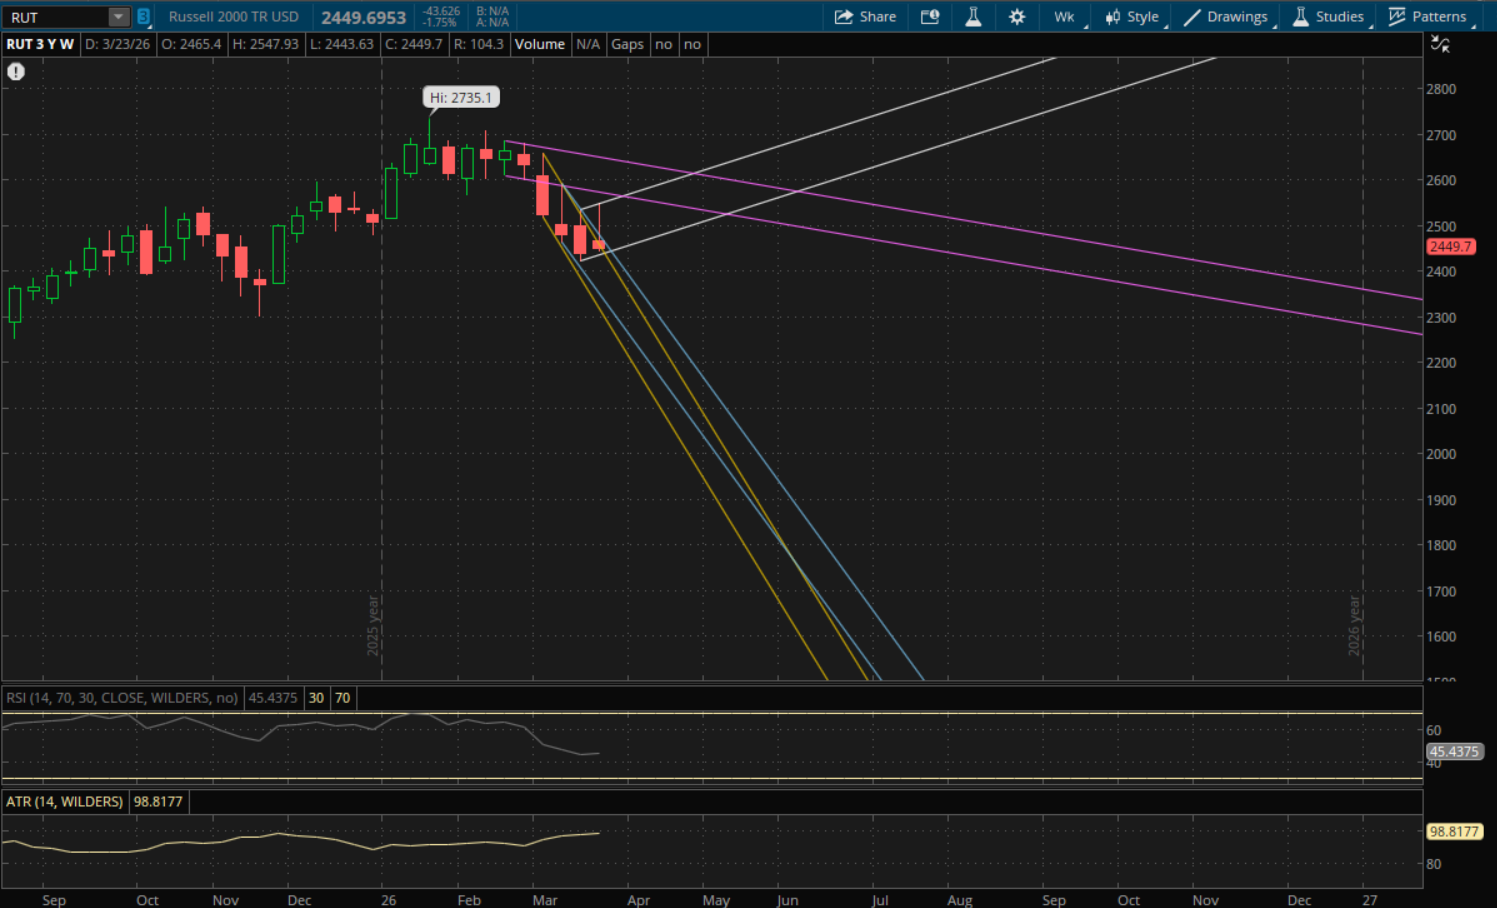
The Russell 2000 looks a bit different here as it had a failed breakout, however it put in a higher high and higher low for the week which starts a new uptrend for it. The problem is that it finished very weak, and it has to gap up on Monday in order to open above its new primary uptrend as that support will be at about 2,450 which is a hair above this week's finish at 2,449.69. So it doesn't need a big gap, but it does need to open higher and ideally it's not a flat open right at 2,450.
If it does manage to open higher on Monday above this 2,450 level, then the next resistance to watch will also be from this primary uptrend at 2,560. Its next resistance will be just above that from its prior downtrend (purple) at 2,565. If it opens lower on Monday, then the 2,450 level becomes resistance and the next support to watch will be at 2,420 from its prior downtrend (blue) followed by its next downtrend (yellow) at 2,390.