On Thursday after the markets closed, President Trump said that he would be extending the pause on attacking Iran's energy facilities to April 6th. This sent futures higher but they reversed their gains overnight and we got another big gap down yesterday with no let up in the selling as markets finished near their lows of day. The selling was led by tech again with the Nasdaq closing down 2.15% while the Russell 2000 and S&P lost 1.75% and 1.67%, respectively. The VIX closed up 13% at $31.05, which is its highest close since April 21st, 2025 during the tariff induced market sell-off.
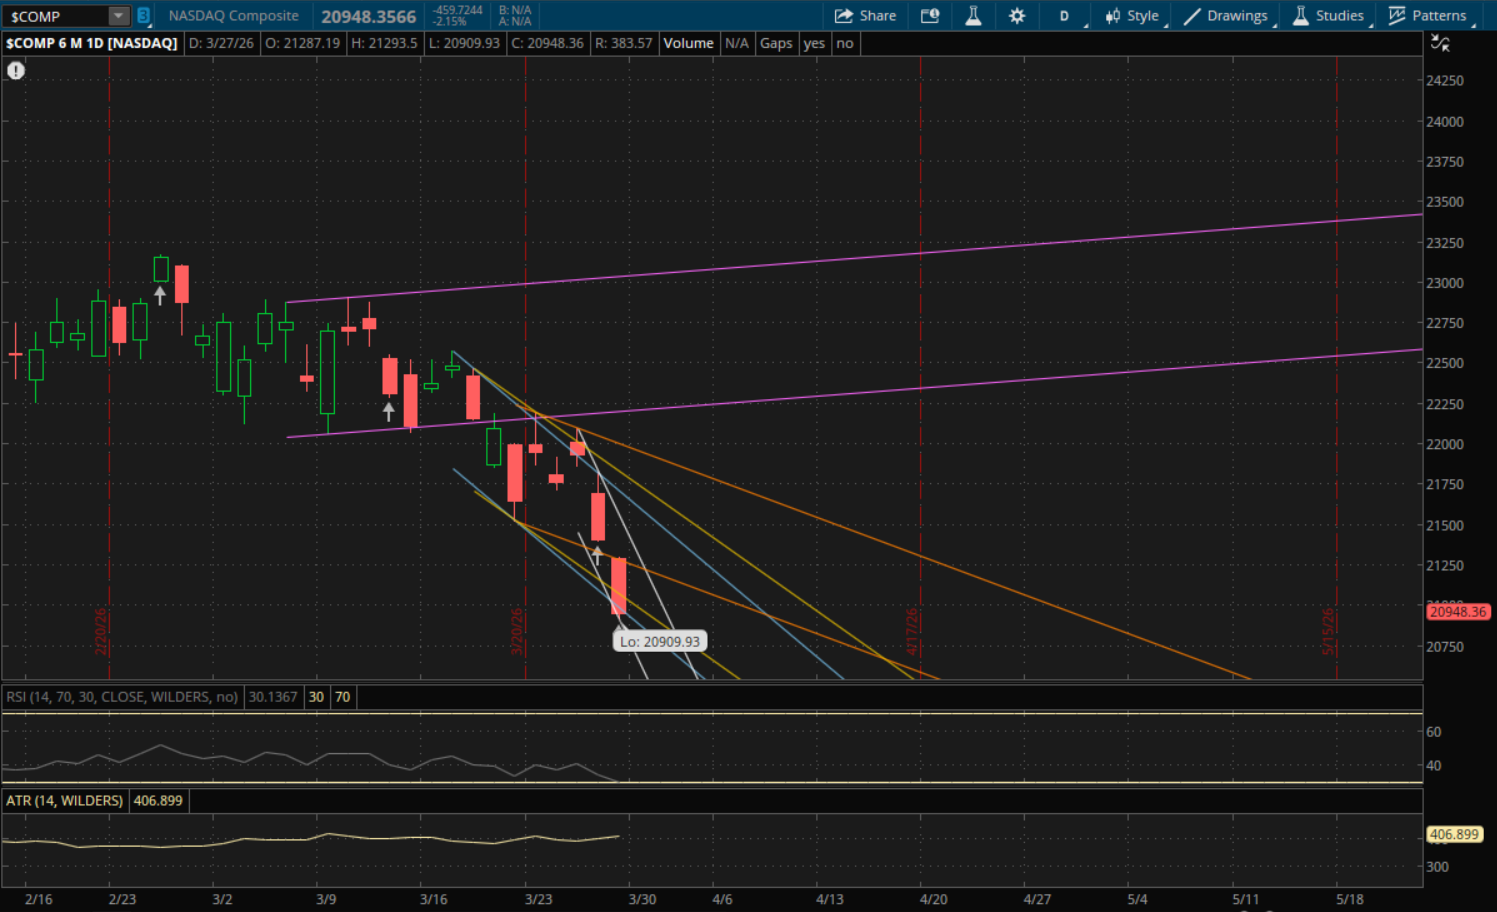
The Nasdaq gapped down right to its first support that I mentioned in the previous update which was its primary downtrend at 21,280-21,285. It opened at 21,287.19, just a hair above this level and quickly broke through it and closed well below it. This now starts another downtrend for it going into Monday's session.
There are a few key daily levels to watch for Monday with the first being from its prior downtrend (blue) which will be support/resistance at 20,875. The Nasdaq closed at 20,948 on Friday, which is above this level. So as long as there is no gap down below that 20,875 level then it will be support. On a bounce, the first resistance to watch will be at 20,975-20,980 from its next downtrend (yellow). We could potentially see a gap above this level as well as it is only 0.15% away. If it can get that gap up, then that level will also be support. The next resistance to watch would be from the next downtrend (orange) at 21,230 followed by its new primary downtrend (white) at 21,270. There will be resistances above these as well, but they're much further away and unlikely to be tested on Monday if we get a rally.
If the Nasdaq gaps down again, or simply breaks through the first support (blue) at 20,875, then the only other daily support to watch will be from its new primary downtrend (white) at 20,630. If it breaks through this support then it would start another downtrend but we'll have to wait to see how it finishes for the next levels.
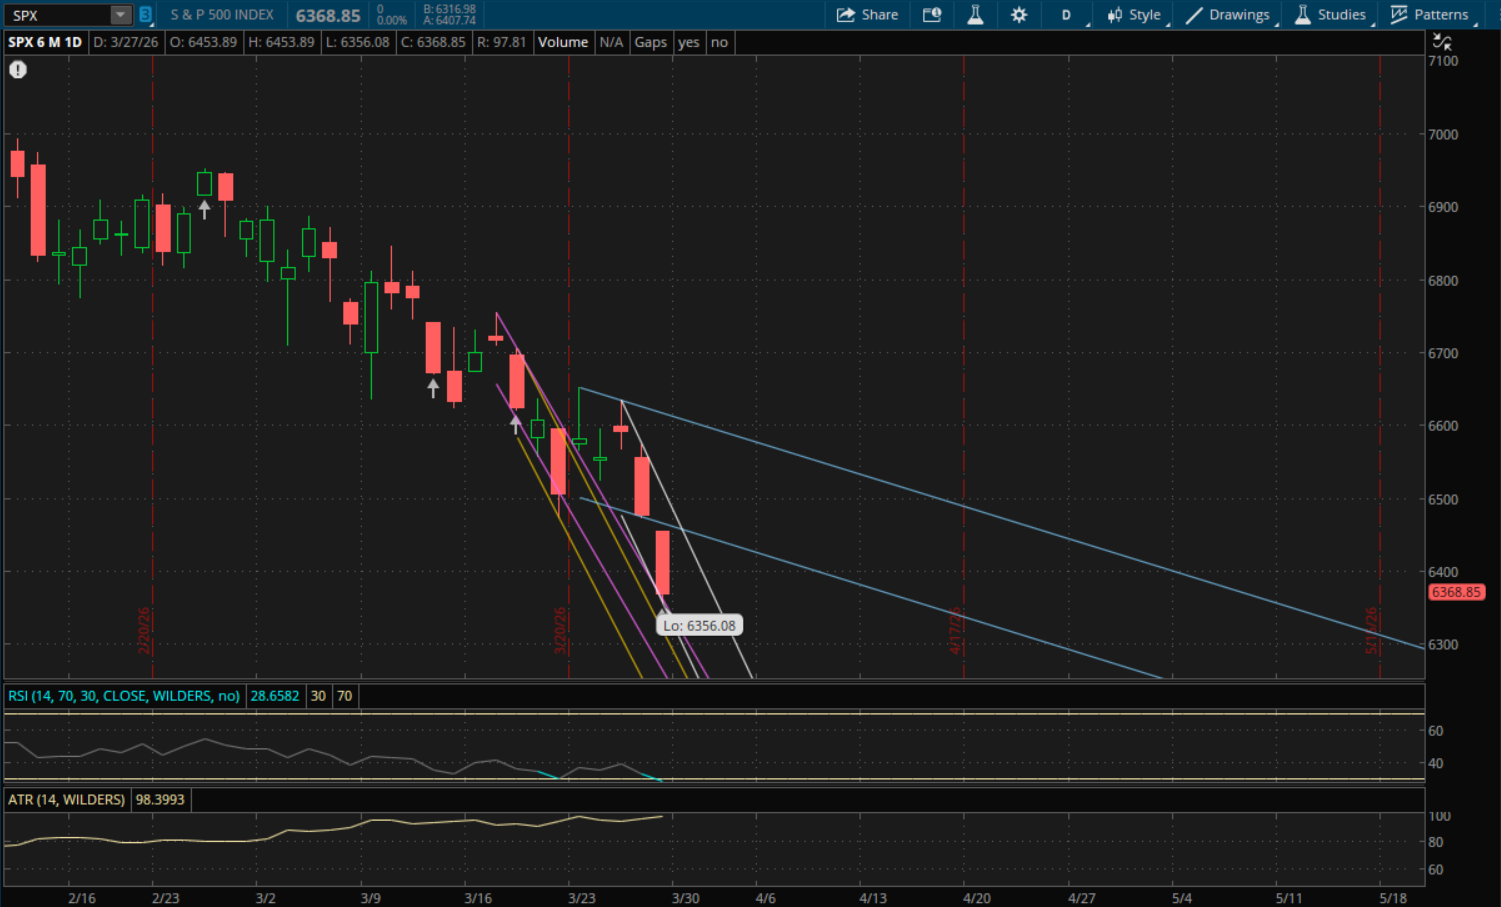
The S&P gapped below its previous downtrend support and also closed well below it, starting a new downtrend. It got down to the next support that I mentioned in the last update which was 6,360. It actually broke just below it as the S&P hit a low of 6356.08, but it was an insignificant break so that prior downtrend (purple) is still valid for now and this will be the next support to watch again which will be at 6,310 on Monday. If it breaks through it, then its new primary downtrend (white) would be the next support at 6,295. After that, its prior downtrend (yellow) would be support at 6,263.
If there's a rally back on Monday the next resistance to watch will be from its new primary downtrend (white) at 6,450. Its prior downtrend (blue) would also be resistance just above that at 6,455.
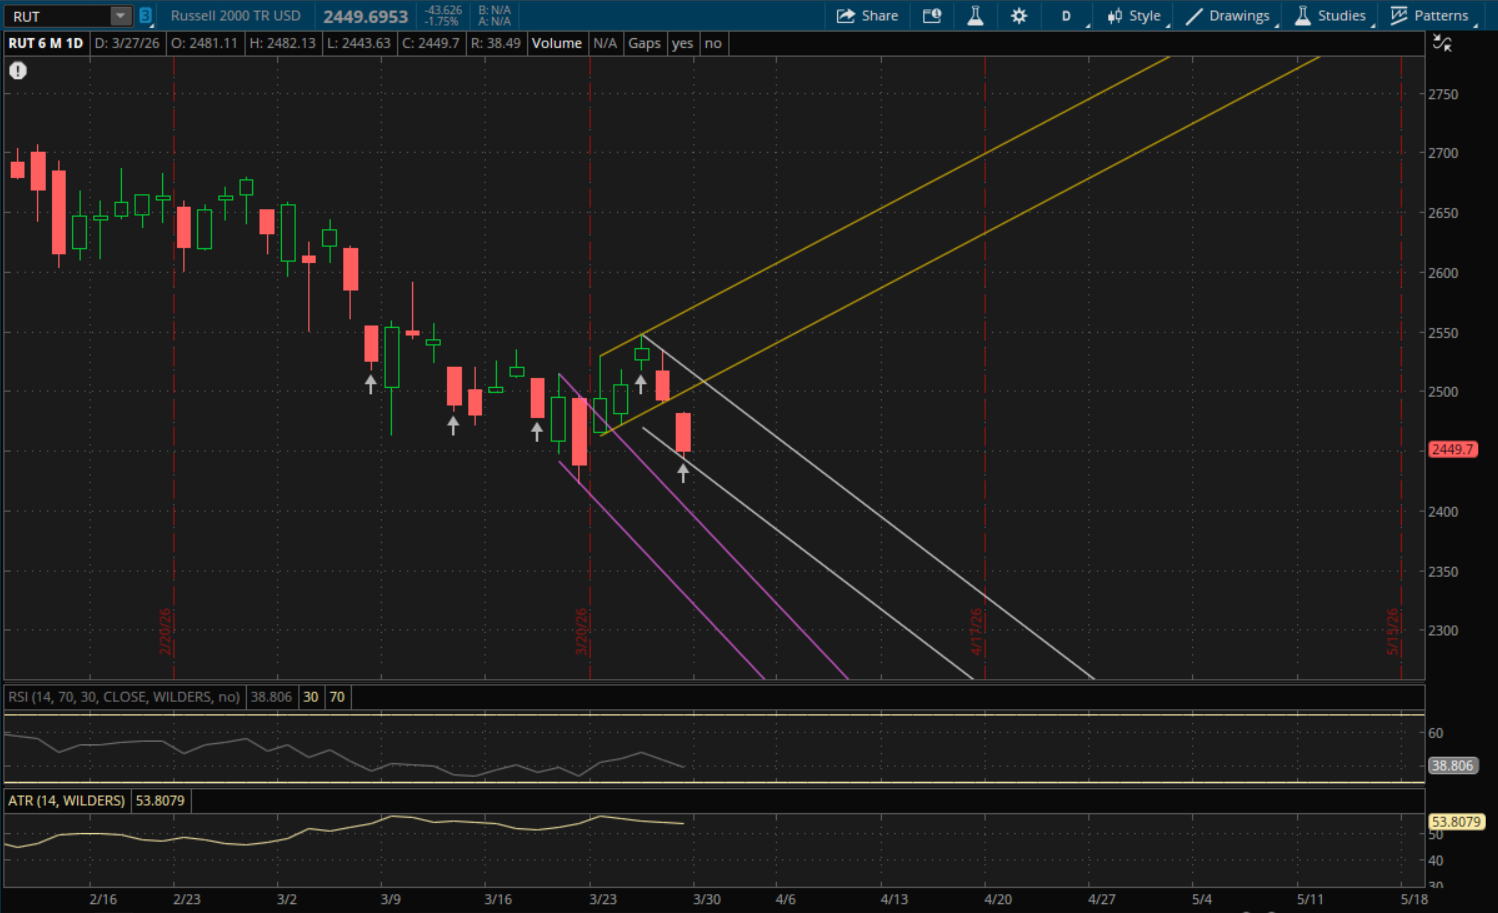
The Russell 2000 also started a new daily downtrend as it gapped and closed below its prior uptrend. Its new primary downtrend (white) is at yesterday's low, so the next support level to watch from this isn't too far at 2,430. If it gaps below it on Monday then that 2,430 level would be resistance and the next support to watch would be from its prior downtrend (purple) at 2,385.
If it does open above the 2,430 level and we get a rally going, then the next resistance level to watch will be at 2,507-2,510 which will be from both its new primary downtrend (white) and its prior uptrend (yellow) that it closed below yesterday.