The markets were pretty flat today as the Nasdaq closed up 0.04% while the S&P closed down 0.04%, both essentially unchanged for the day. Small caps on the other hand were weak again as the Russell 2000 closed down 0.6% after the Fed left rates unchanged in Jerome Powell's final presser as Fed Chair. Markets were also waiting on some big tech earnings after the close and so far Alphabet is the only winner. GOOG/GOOGL is up about 6% after hours on their report while Amazon (AMZN) is down about 2% and Microsoft (MSFT) is down about 2.5%. The big loser is Meta (META) which is currently down over 6%. Even though markets were essentially flat today, the VIX gained 5.5% to finish at $18.81. But the increase in volatility may have just been due to the catalysts between the Fed and all of the earnings reports.
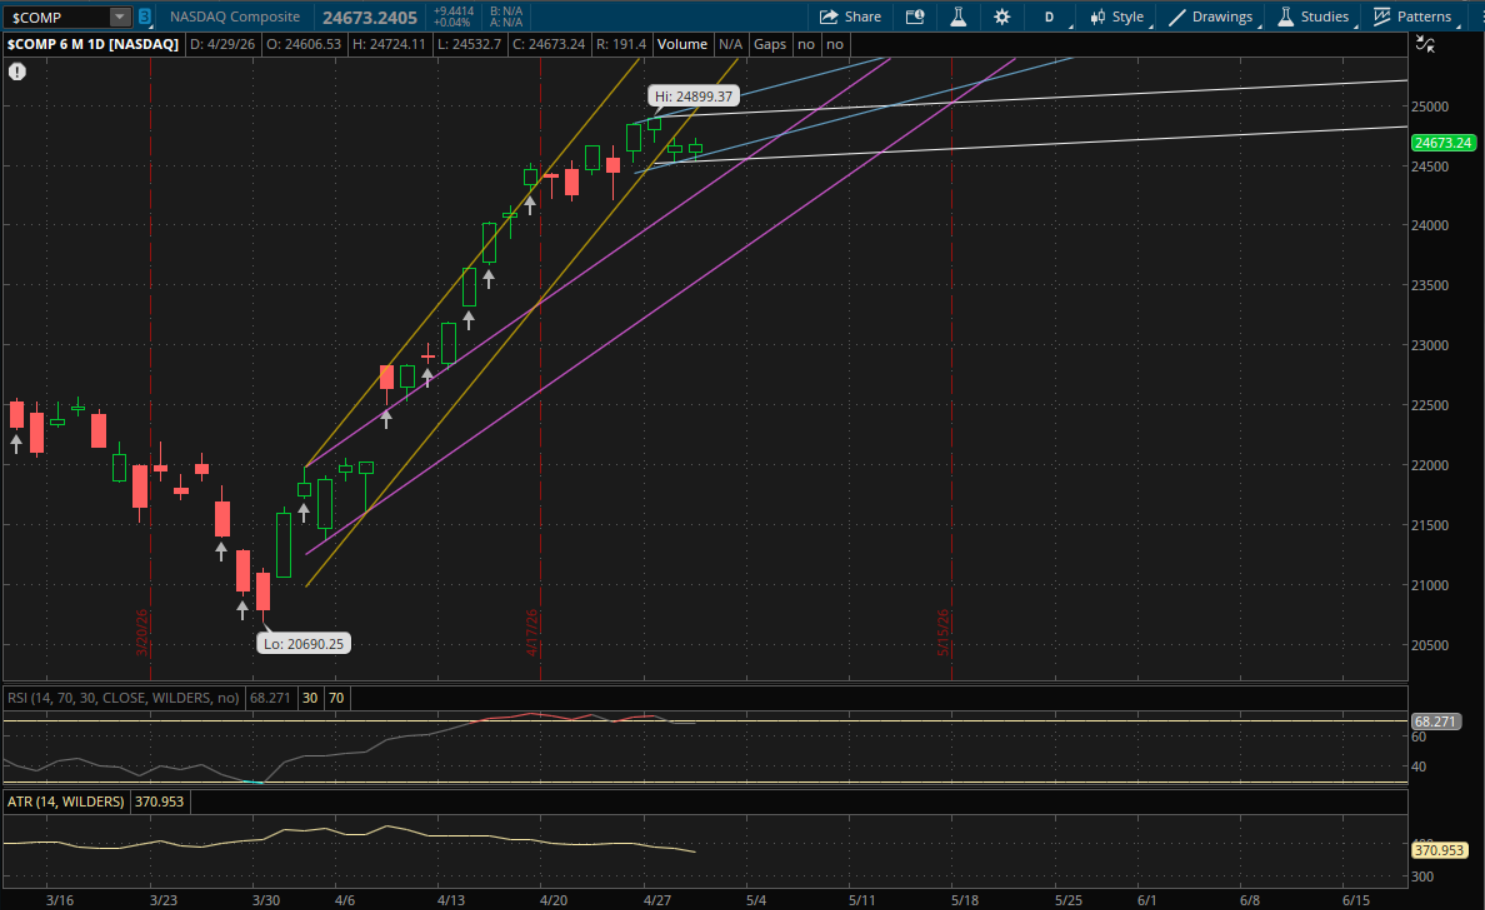
This morning the Nasdaq did break through yesterday's primary uptrend, but it also rallied back to close above it to give it a failed breakdown which starts a new sideways range for it. The first support to watch for tomorrow will be at about 24,615-24,620 from the retest of today's failed breakdown (blue). After that, its new primary range (white) will be support at about 24,540 and if this doesn't hold then the last support to watch will be from its prior uptrend (purple) at about 24,380. There is risk of a gap below these levels, especially the first two (blue and white), given the action after hours with all of the big tech earnings reports. If it fails to open above any of those, they will be resistance instead.
If the Nasdaq does open above these supports and we continue the rally, the next resistance to watch will be from its new primary range (white) at 24,925. Above that level, there will be more resistances at about 25,035 (blue) and 25,175 (yellow) in the event of a big rally tomorrow.
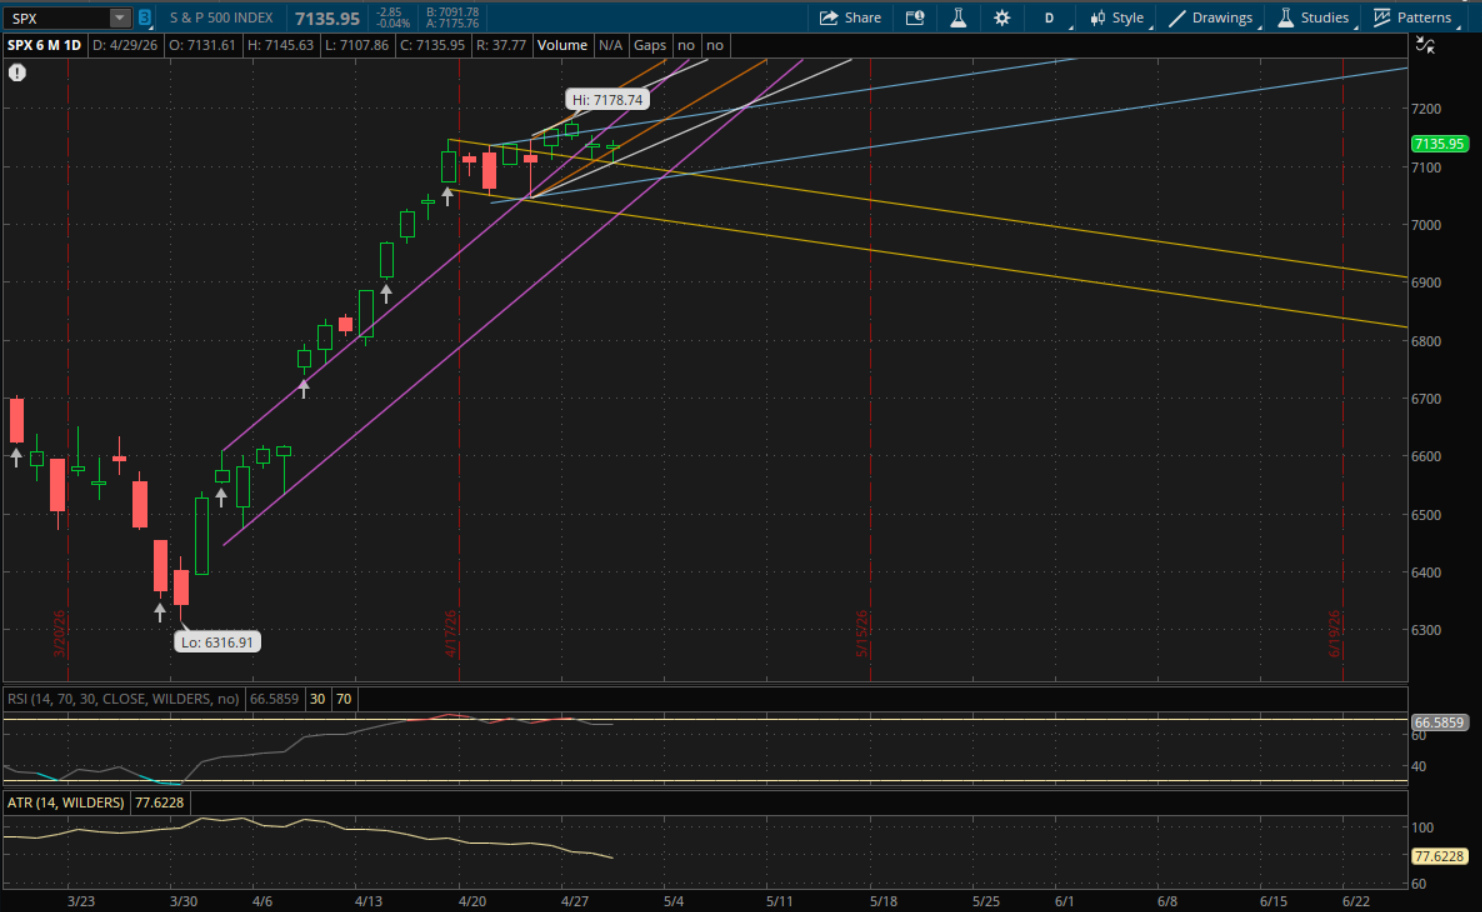
The S&P also broke yesterday's primary uptrend but rallied back to reclaim it, giving it the same failed breakdown as the Nasdaq. For the S&P it starts a new uptrend, though it has the same gap down risk due to all the big earnings out after hours. The first level to watch tomorrow will be on a retest of today's failed breakdown (orange) which will be at about 7,152 and is above where the S&P closed at today (7,136). So it would need to gap up in order for this to be support. The next support to watch would be from its new primary uptrend (white) at 7,124 which it could end up gapping below, in which case it would become resistance. If it gaps or breaks below its primary uptrend then its next support would be from its prior downtrend (yellow) at 7,100. The last support likely to be in play on a larger sell-off would be at 7,073-7,075 from its next uptrend (blue).
If the markets do manage to gap up tomorrow then the retest of today's failed breakdown (orange) at 7,152 will be the first resistance to watch. And if the rally resumes, the next resistances will be at 7,175 (blue) and then 7,205 (purple). There would be more resistance around 7,230 from its primary uptrend (white) but it's probably unlikely to be tested tomorrow.
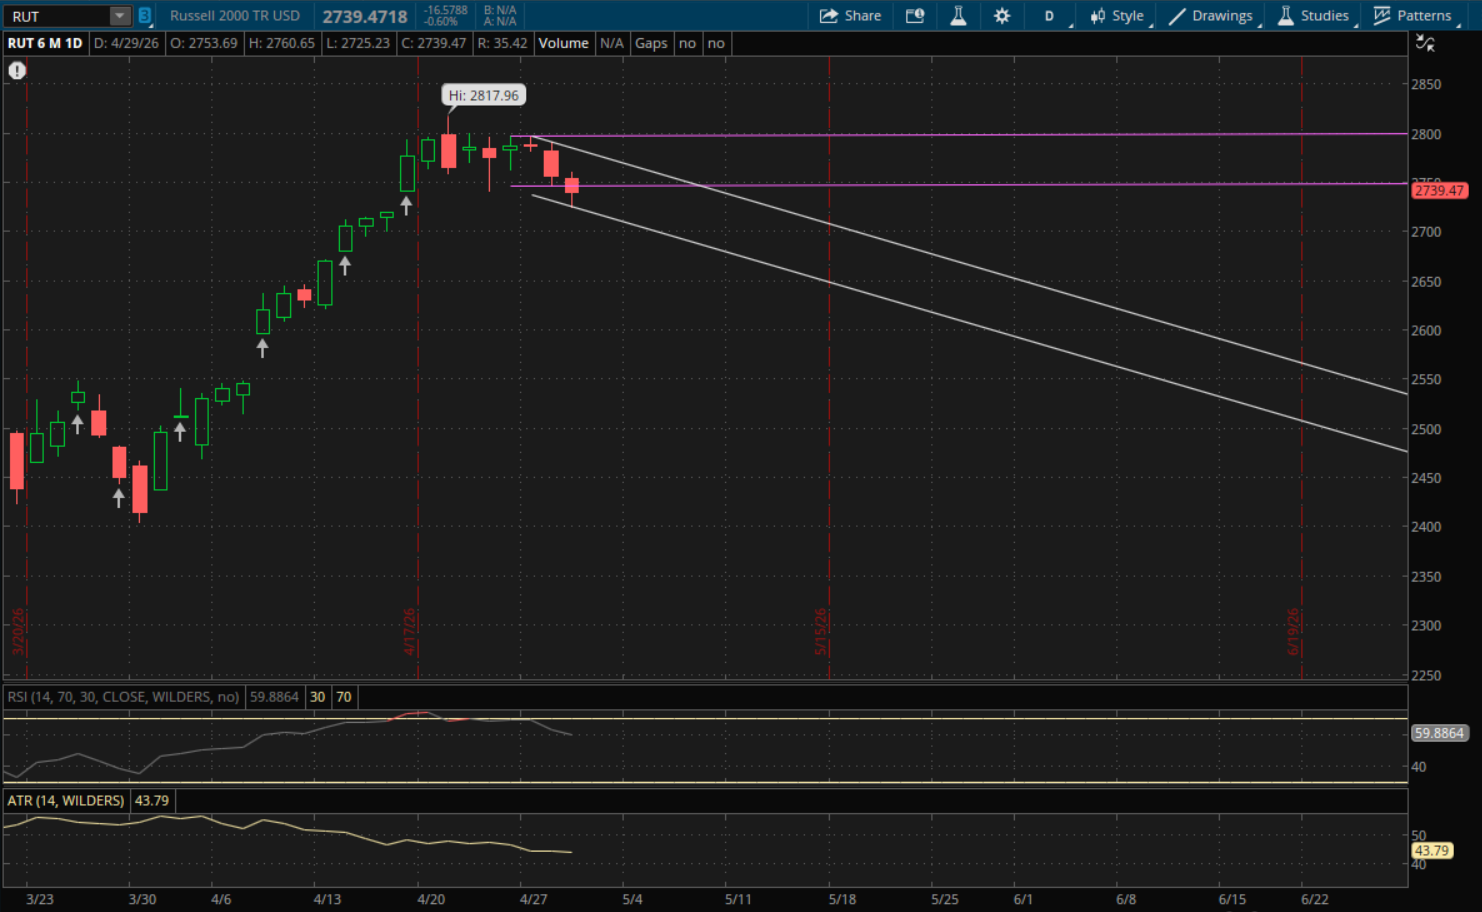
The Russell 2000, which was the laggard again today, initially bounced off of the 2,746 level this morning. This was its new primary range and the only support I was looking at yesterday. However it ended up breaking down through it later and it closed below it - starting a new downtrend. Its prior uptrends are also no longer in play so the chart is much cleaner now as there are only two ranges to look at.
The only support for tomorrow will be at 2,719 which is from the new primary downtrend (white). The first resistance to watch on a bounce will be from yesterday's sideways range (now purple) at about 2,745-2,746. If it manages to gap above this level then it will become support, otherwise it remains as the first resistance level. After that, its new primary downtrend (white) would be the next resistance (from the top of the range) at about 2,778 if we were to get a rally back. The last resistance would be from its sideways range again (top of the range) at 2,796-2,797 in the event of a big snap back rally.