The markets had a strong rally to close out the month with small caps leading the way as the Russell 2000 closed up 2.21%. The S&P gained another 1.02% and hit new all time highs again while the Nasdaq gained 0.89% and hit new all time highs as well. The VIX got crushed, closing down 10.21% at $16.89 - its lowest close since February 2nd. Apple (AAPL) reported earnings after the close which topped estimates, but the stock is currently down about 1%.
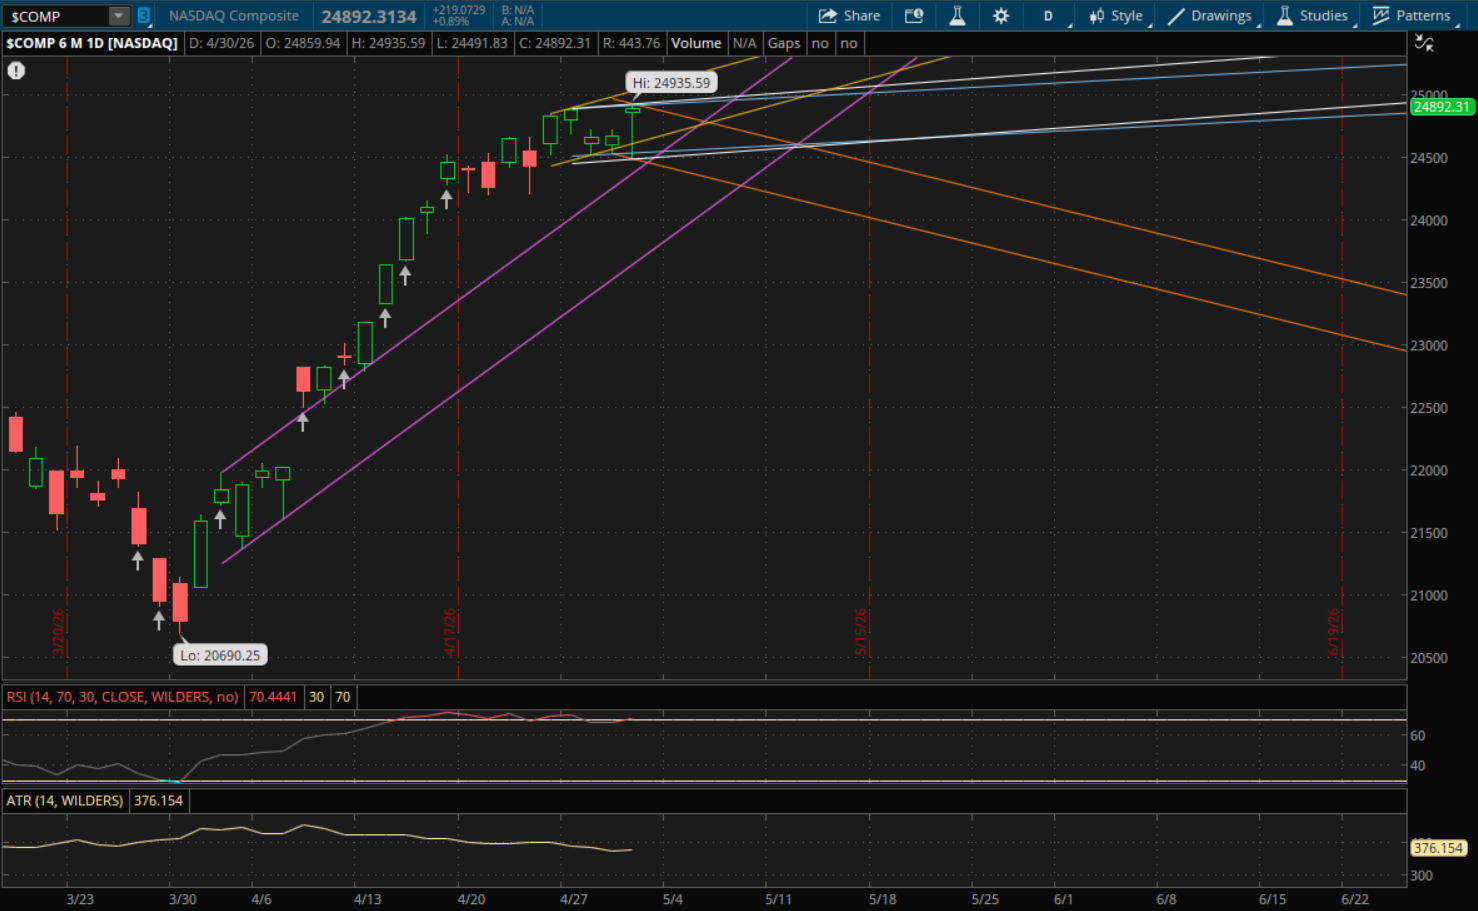
The Nasdaq broke above and below yesterday's primary range and it closed inside of the range, so now it starts two new daily trends. For tomorrow the first resistance to watch will be from its new downtrend that it started today (orange) at about 24,895 which it essentially closed at today (24,892). So it could gap above this tomorrow in which case that level would then become support. The next resistance to watch would be from its prior uptrend (blue) at 24,930-24,935 and then its new uptrend (white) at about 24,950. If it breaks through these levels, its last resistance would be from its prior uptrend (yellow) at 25,075-25,100.
If the Nasdaq fails to open above its first resistance (orange) at 24,895 tomorrow then that will be resistance and the next support to watch on a pullback would be from its prior uptrend (yellow) at about 24,660. After that, its next trend (blue) would be support at 24,550. The next support to watch will be at about 24,500 from both its new range (white) and its prior uptrend (purple) where they both intersect. If those don't hold, the last daily support to watch would be from its new downtrend that it started today (orange - from the bottom of the range) at about 24,450.
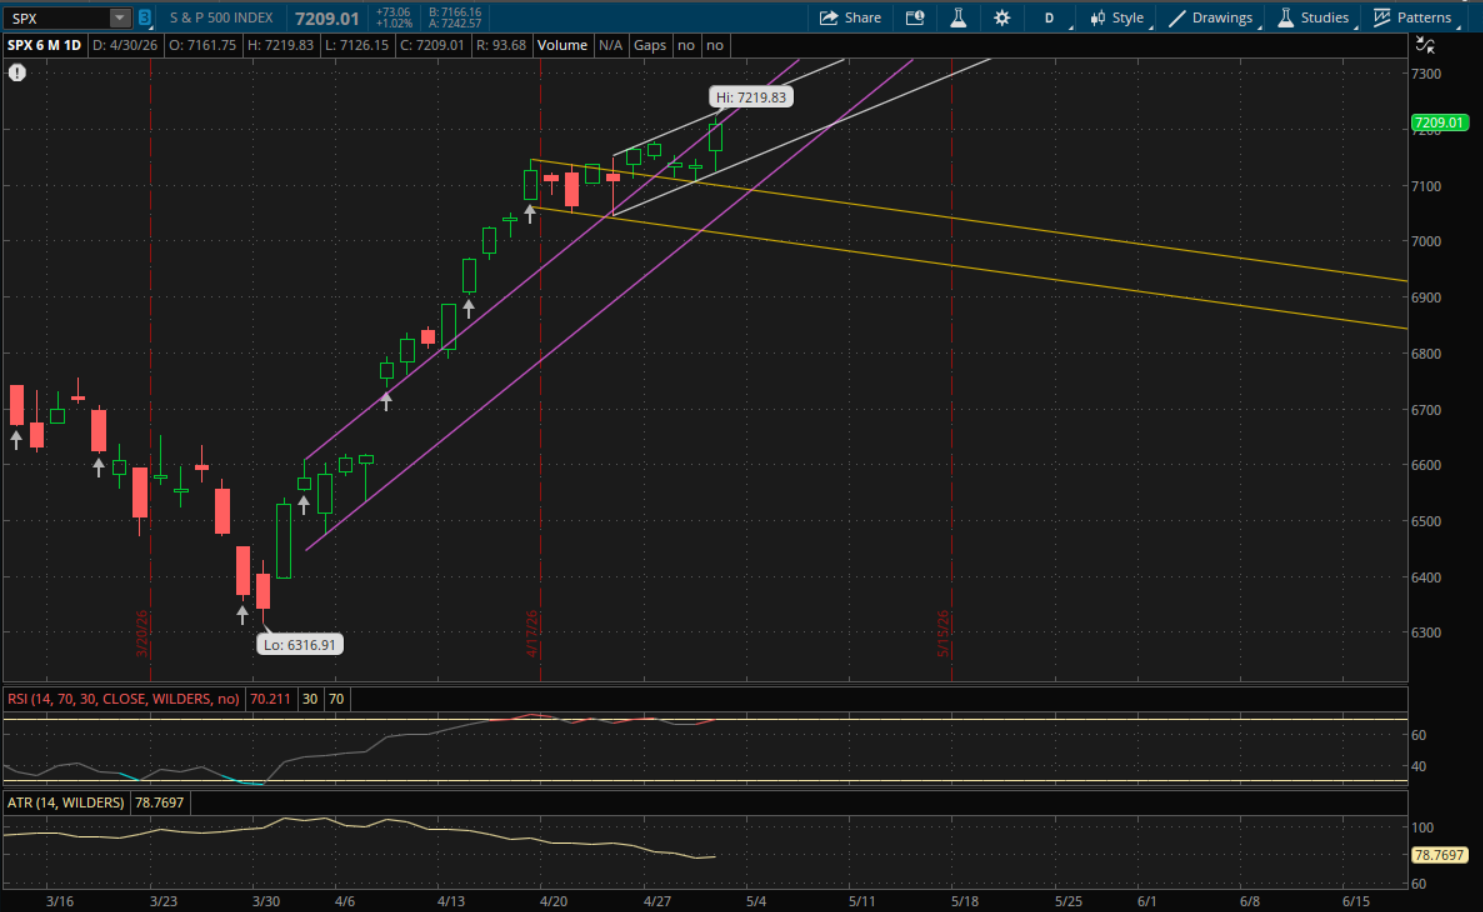
The S&P opened above its primary uptrend support this morning and held it on an early test in the morning. It didn't break through the 7,124-7,125 support as it put in a low of 7,126.15, so it doesn't start any new ranges. But it did break through several of its prior ranges which invalidated some of those.
For tomorrow, the next resistance to watch will be from its prior uptrend (purple) at 7,235 followed by its primary uptrend (white) at 7,245. For now those are the only resistance levels to watch. On a pullback, its primary uptrend (white) will be the first support at about 7,138. If that breaks, then its next support will be from its prior downtrend (yellow) at 7,096 and the last potential support would be from its next uptrend (purple - bottom of the range) at about 7,070 in the event of a larger sell-off.
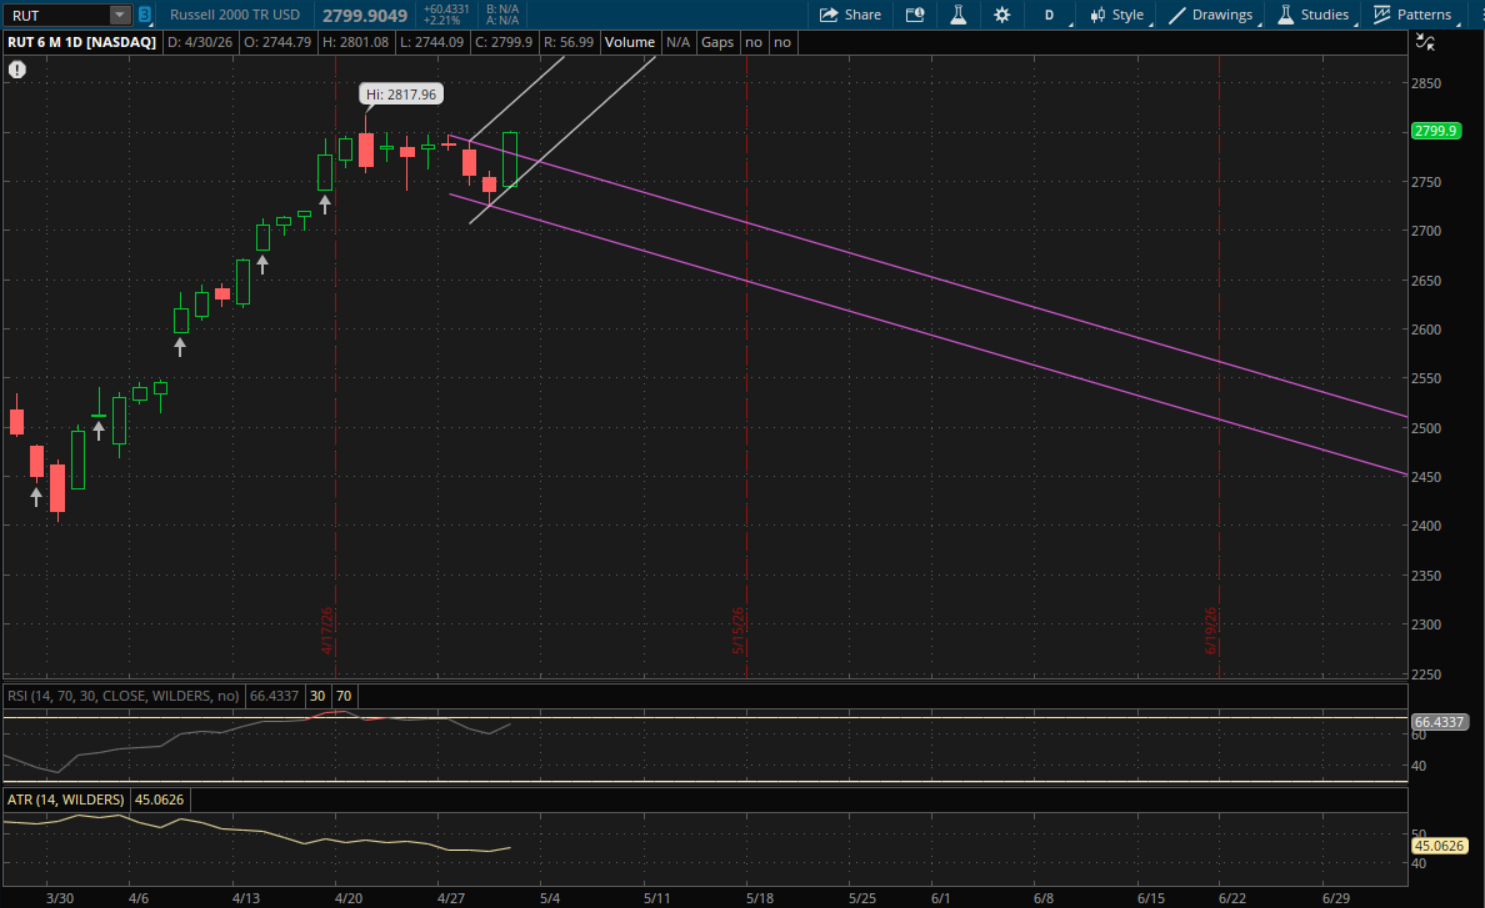
The Russell 2000 gapped up right to its prior sideways range and quickly broke above it this morning, and it broke and closed above its primary downtrend. Now it starts a new uptrend going into tomorrow. Its new primary uptrend will be the only resistance to watch which will be at 2,845-2,847 if we get another big rally.
On a pullback, its prior downtrend (purple) will be the first support at 2,272-2,273 and if that doesn't hold its new primary uptrend (white) will be the next support at 2,763-2,764. If its primary uptrend doesn't hold, then the last support will again be from it prior downtrend (purple - bottom end of the range) at 2,713 if there's a big sell-off.