The markets had a very strong month with the S&P closing up 10.4% to new all time highs. This was its best month since April of 2020. The Nasdaq was even stronger as it closed up 15.3% which was also its best month since 2020. Small caps participated as well with the Russell 2000 gaining about 12% which was its biggest monthly gain since November of 2023. After being very strong all year, the VIX finished April down 33%.
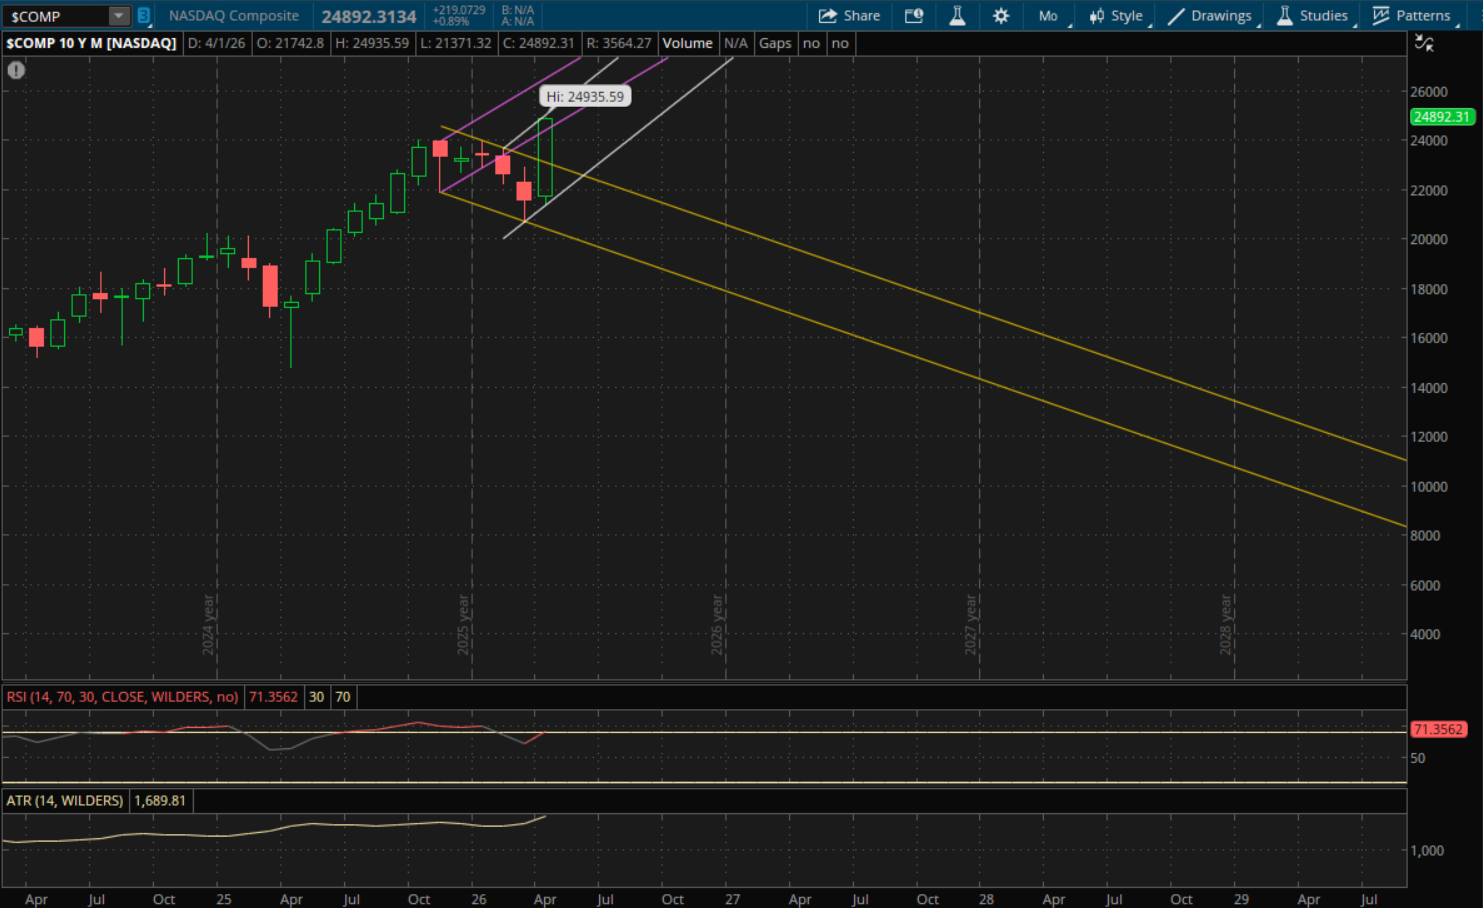
With the strong finish for the month, the markets started new monthly uptrends as they broke and closed above their prior primary downtrends. For the Nasdaq, the first monthly level to watch will be from its prior uptrend (purple) at about 24,980. It closed at 24,892 today, so it will act as resistance unless it gaps above it tomorrow. It's only about 0.35% away so we could get that gap over it, in which case it will be support. From there, its new primary uptrend (white) will be the next resistance at about 25,750. If it can break through this level in May, then its last monthly resistance will be from its prior uptrend (purple) again at 27,000-27,050.
If we get a pullback next month, its next support is pretty far away at about 22,800 from its prior downtrend (yellow). This is about 8% away from today's close of 24,892. Its next monthly support would be from its new primary uptrend (white) at about 22,075. If there's a big sell-off and that doesn't hold either, then its last monthly support would be from its prior downtrend (yellow) again at about 22,100.
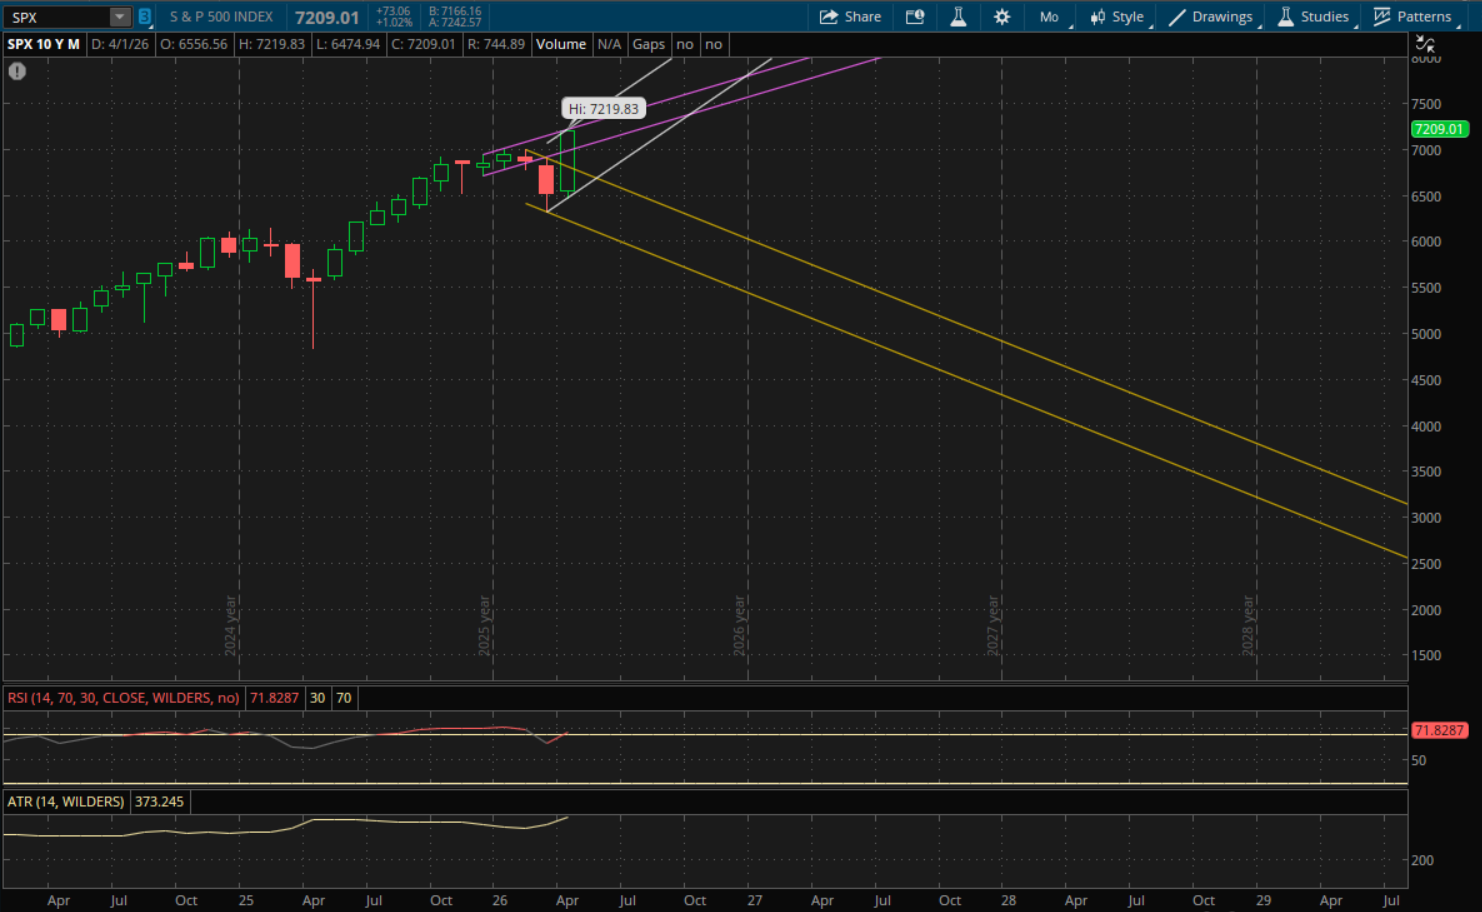
For the S&P, its first monthly resistance will be at about 7,290 from its prior uptrend (purple). It closed at 7,209 today, so we probably won't get a gap above 7,290 tomorrow as it's about 1.1% away. But, if it does get that gap above it then the 7,290 level would be support. Its last monthly resistance would be from its new primary uptrend (white) at 7,380.
On a pullback, its first support will also be from its prior uptrend (purple - bottom end of the range) at 7,065-7,070. If that doesn't hold, its next support is much further away at 6,715-6,720 from its prior downtrend (yellow). After that, its primary uptrend (white) comes back into play from the bottom end of the range at 6,640-6,650. In the event of a massive sell-off, which is probably extremely unlikely, its last monthly support would be from its prior downtrend again (yellow - bottom end of the range) at about 6,130. But again, this is an extremely unlikely 'worst case' scenario.
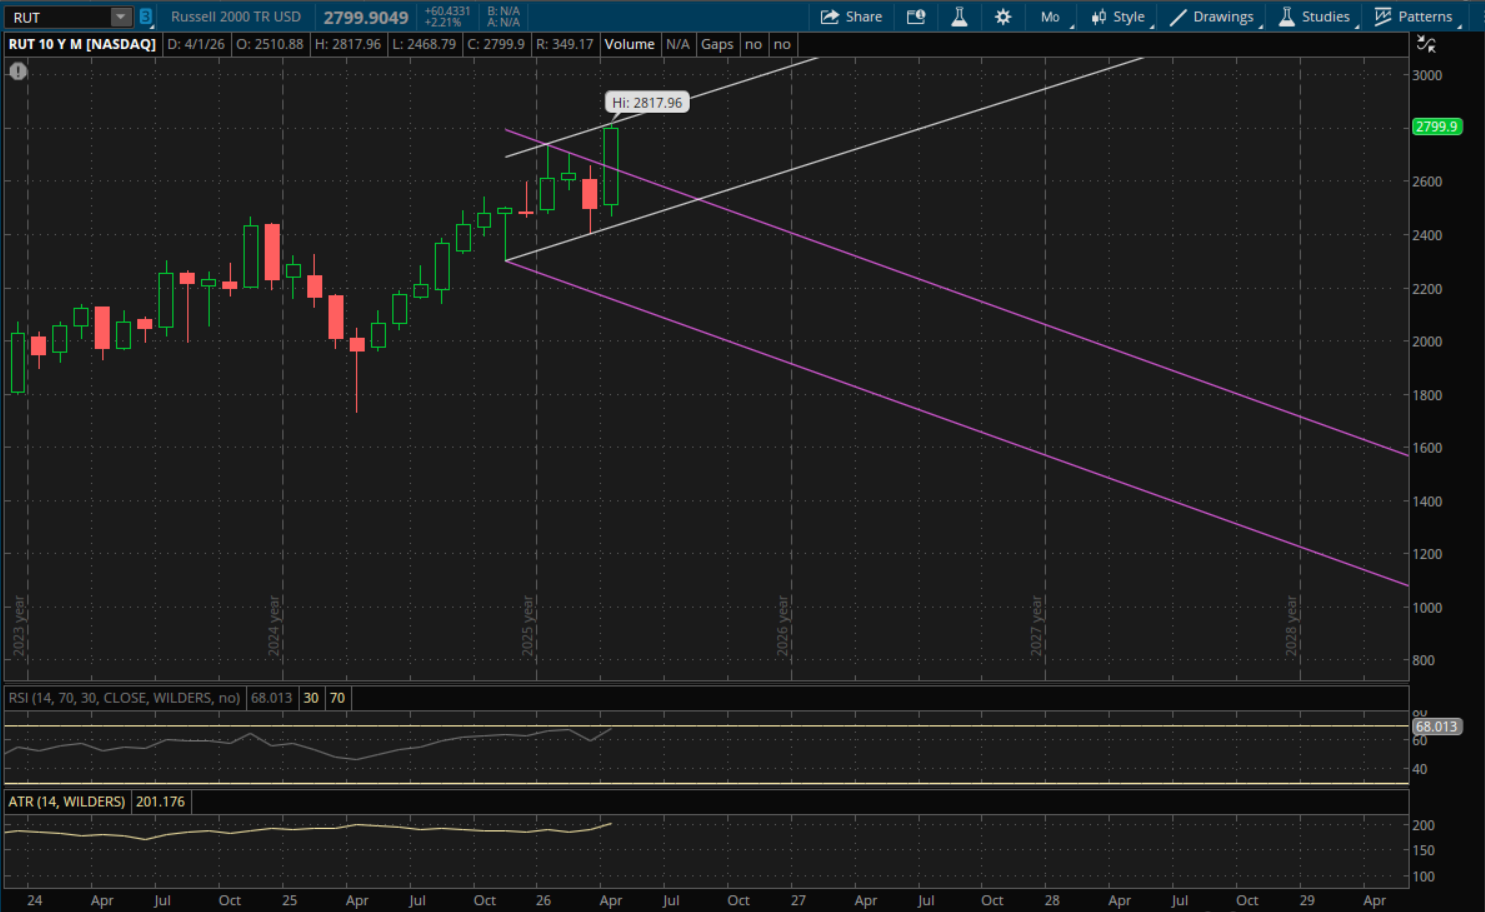
The Russell 2000 also started a new monthly uptrend, and for May this will be the only resistance level to watch until a new trend starts. That new primary uptrend (white) will be at about 2,845 which is about 1.6% away. If there is a big gap up tomorrow above that 2,845 level it would be extremely bullish as that new primary uptrend would then be support.
On a pullback, its first support would be from its prior downtrend (purple) at about 2,620. After that, its new primary uptrend (white) comes back into play from the bottom end of the range at 2,450-2,460. If that doesn't hold, and we get a big sell-off with some catalyst, then the worst case scenario support would be from its prior downtrend again (purple - bottom end of the range) at 2,130. But again, this is extremely unlikely to happen.