The markets finished higher last week with tech leading as the Nasdaq gained 2.4% for the week. The Russell 2000 added 1.7% while the S&P also closed higher by 1.4%. All three indexes hit new all time highs and the Nasdaq and S&P extended their win streak to 9 straight weeks. The VIX on the other hand closed down again at $15.32, falling 8.3% for the week. This was its lowest weekly close since the first week of this year.
There is a lot of economic data this week with PMI and ISM on Monday, JOLTS (job openings) on Tuesday, ADP employment report on Wednesday, and jobless claims on Thursday. But the main event will be on Friday morning when we get the May employment situation report which will include month over month nonfarm payrolls as well as the unemployment rate.
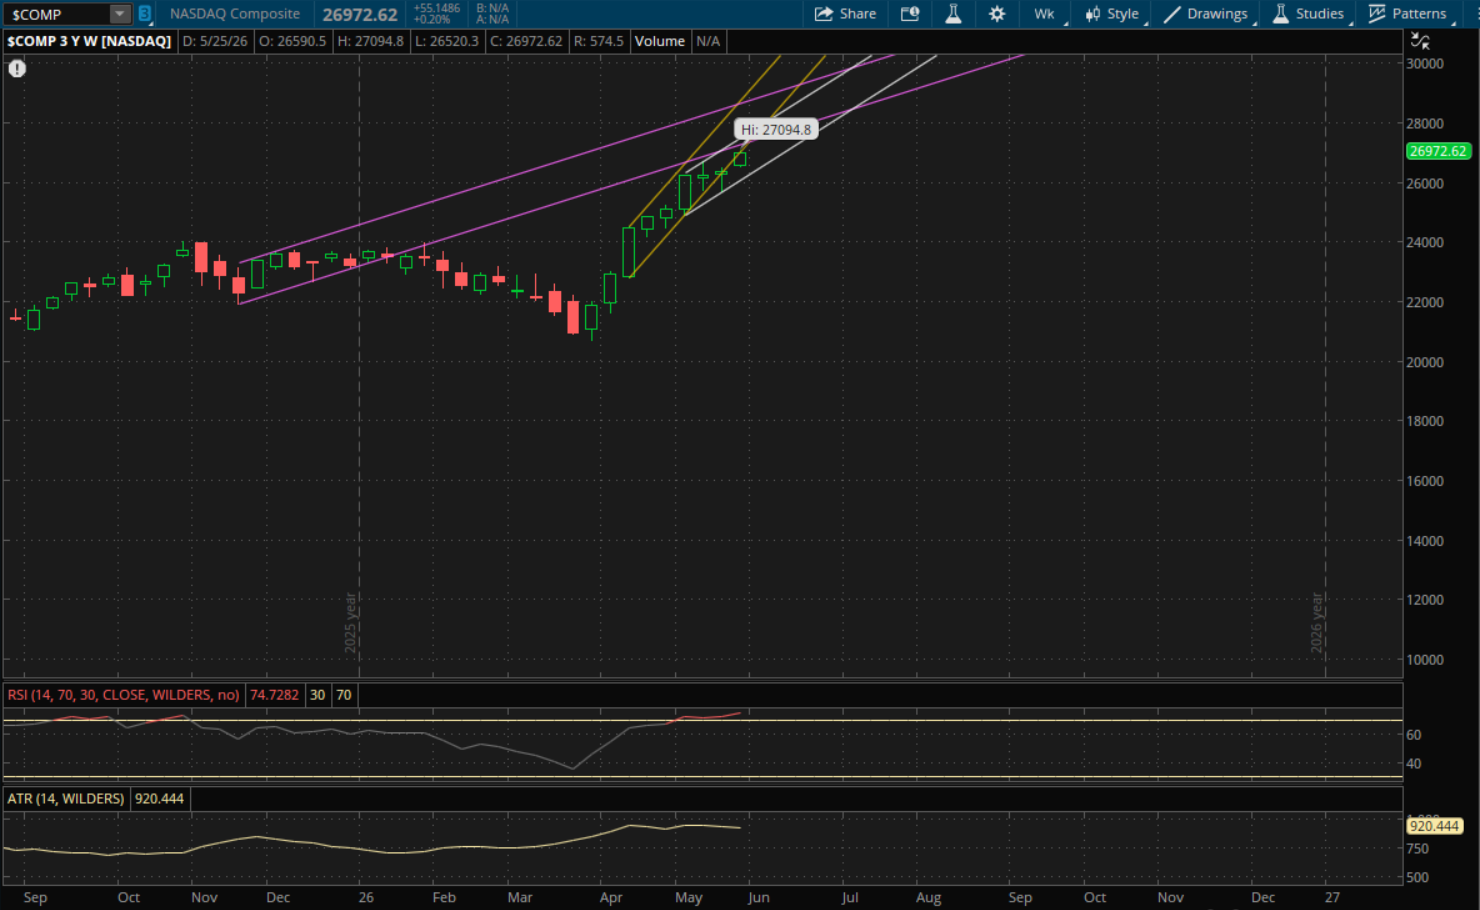
In last weekend's update I noted that the Nasdaq had a failed weekly breakdown and that the next resistance to watch would be at 27,000-27,050. It got just above this level to a high of 27,094.80. The Nasdaq didn't break through its primary uptrend, so it doesn't start any new trends for this week.
The first resistance to watch now will be from its prior uptrend (purple) at about 27,450. If it breaks through this, the next resistance will be at about 27,750 (yellow) and the last weekly resistance to watch will from its primary uptrend (white) right around 27,900 if we get another big rally.
The only support to watch on a pullback will be from its primary uptrend (white) right around 26,500. If this doesn't hold, it will start a new primary trend going into the following week, but we'll have to wait and see how it finishes to determine the direction of this new trend.
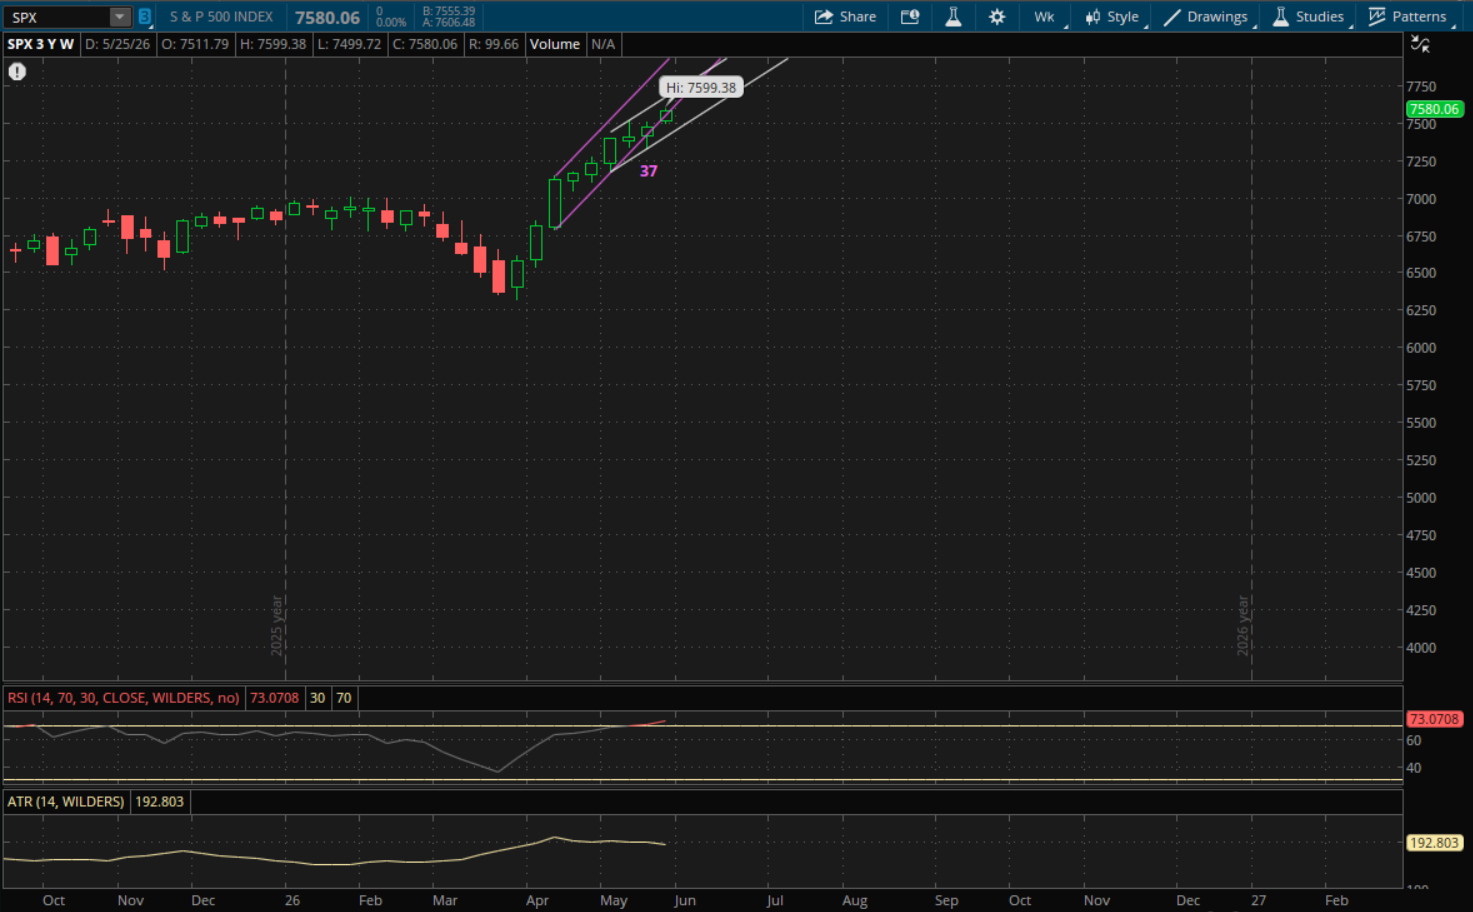
The S&P didn't break through its primary uptrend last week, so it doesn't start any new trends for this week either. The first resistance level to watch for this week will be at 7,690 from its prior uptrend (purple). If it can break through this area, its primary uptrend (white) will be the last weekly resistance at 7,760.
On a pullback, the only support to watch will be from its primary uptrend (white) which will be just under 7,500. If it breaks, it will start a new trend going into the following week but we'll first have to wait and see how it closes to determine the direction of that new trend.
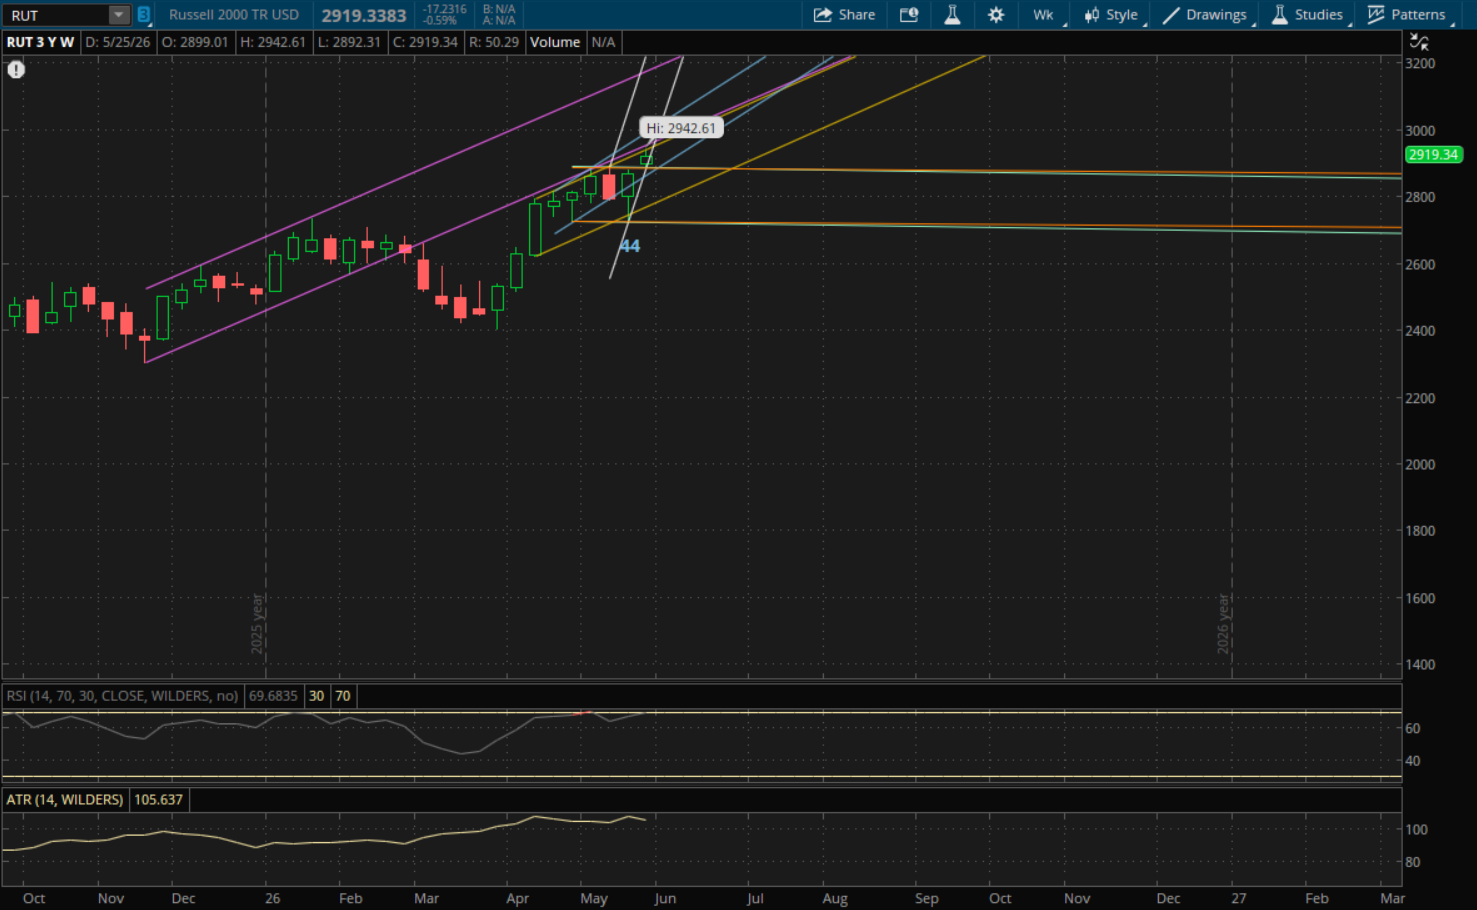
The Russell 2000 got rejected right at its first weekly resistance at 2,943 which was the level I pointed out in last weekend's update. It put in a high of 2,942.61 before pulling back on Friday to finish at 2,919. It did gap above its prior primary trend, and it made a higher high, so it did start a new uptrend for this week. However, it won't open above it tomorrow as its new primary uptrend (white) will be at about 3,070 which is over 5% away.
So, the next weekly resistance level to watch on a continuation of the rally will be from its prior uptrend (yellow) at about 2,967. After that its next uptrend (purple) will be at 2,980 followed by its next uptrend (blue) at 3,030. Its last resistance would be from the primary uptrend at 3,070. However, with it being over 5% away it's unlikely it actually gets there. Even the 3,030 level (blue), may not be in play for this week.
On a pullback, the first support to watch will be just above 2,900 from its prior uptrend (blue) with the next two supports at 2,885-2,990 from its prior sideways ranges (orange and green). If there's a bigger pullback, the next support would be just below 2,800 from its prior uptrend (yellow). The last two supports would be at 2,720-2,725 from the same two sideways ranges (orange and green - bottom of those ranges).