The markets were strong again for the month of May with the Nasdaq closing up 8.4% as tech led the way higher while the S&P added another 5.1%. The Russell 2000 was the laggard as yields rose, but it also gained 4.3% for the month. Meanwhile Gold, Silver, and Bitcoin all fell as the Dollar gained nearly 1%. Oil was the big loser in May, closing down over 16%, as reports continue to come in of a potential de-escalation between the U.S. and Iran.
Aside from the upcoming May jobs report this Friday, the biggest thing markets will have to look forward to in June is the next Fed rate decision on June 17th. This will be the first rate decision under new Fed Chair Kevin Warsh. Currently, markets are pricing in no change in rates for the upcoming June meeting with a 99.3% probability. Right now there are no cuts being priced in for the rest of 2026, and the market is actually pricing in a 25bps rate hike as the next Fed move in March of 2027 with a 40% probability.
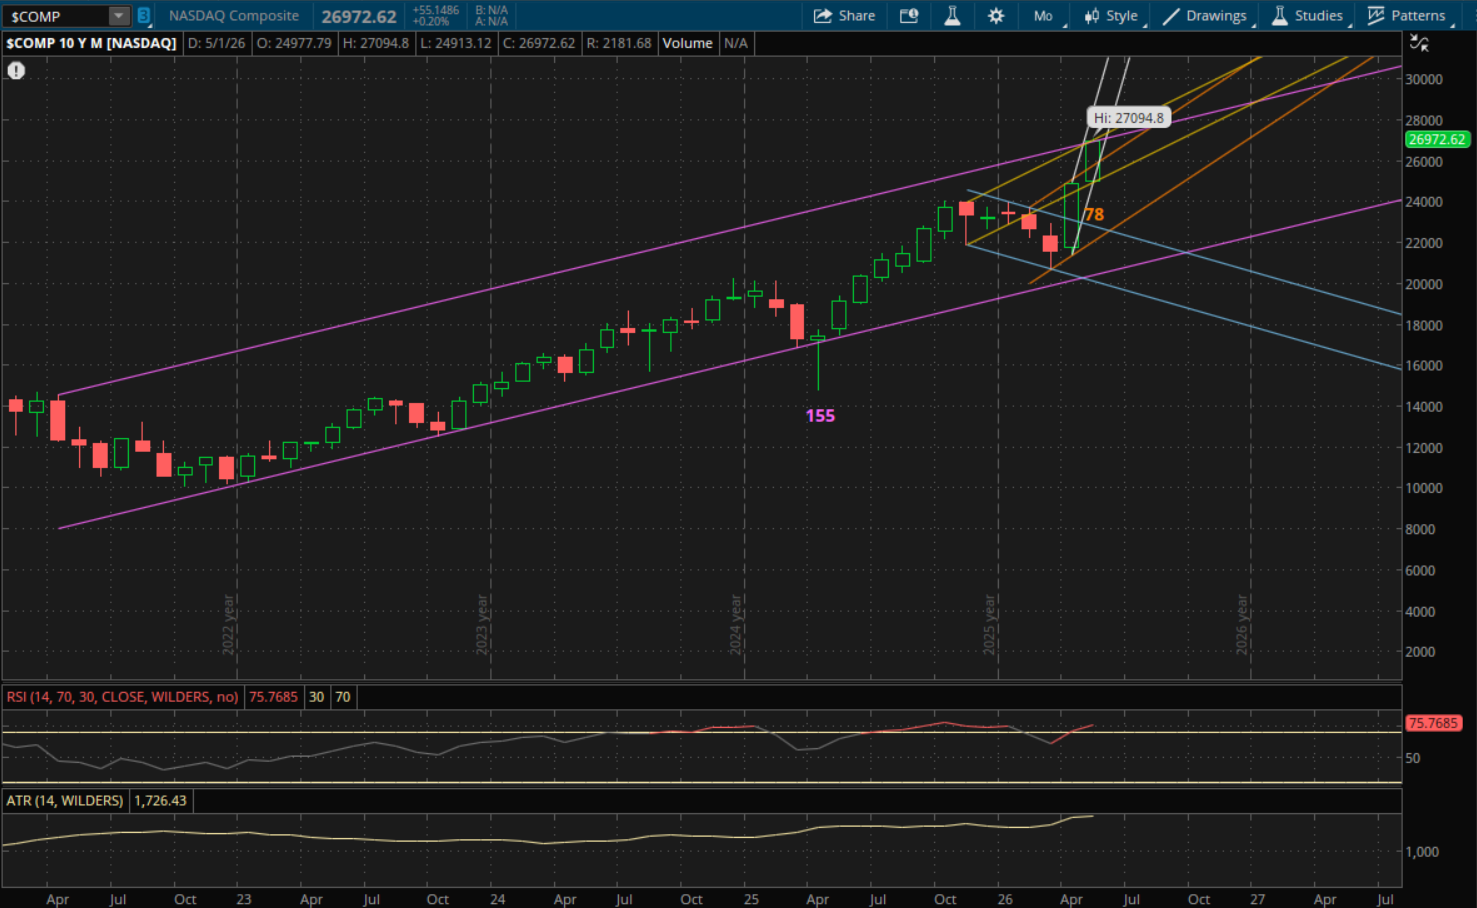
Looking at the technical setup, there is some cause for concern here as the Nasdaq did start a new uptrend heading into June, but it's not going to open above the new primary uptrend (white) as it will be around 28,500 which is about 5.6% away. So it's going to open outside of its new uptrend, which means it will be resistance if it continues to rally up there. There will also be other resistance levels to watch starting with its long term uptrend (purple) at about 27,200 which is still almost 1% away from Friday's close of 26,972. There is potential for a gap above this 27,200 level if we get a big gap up tomorrow, but the odds are it will also be resistance on a rally attempt. After that, its next uptrend (yellow) will also be resistance at about 27,550 if it can gap above or break through the first resistance (purple).
On a pullback, the first support to watch will be from its prior uptrend (orange) at about 26,425-26,450. This would only be about a 2% pullback. If it doesn't hold, the next support will be from its next uptrend (yellow) at about 25,475 which is around 5.5% away. That probably will be the only support that actually gets tested, unless there's something to spark a big sell-off in which case the next two supports would be at about 22,750 (orange) and 22,500 (blue). These last two levels would be 15-17% away, and again it's extremely unlikely that they're actually tested without some sort of black swan event.
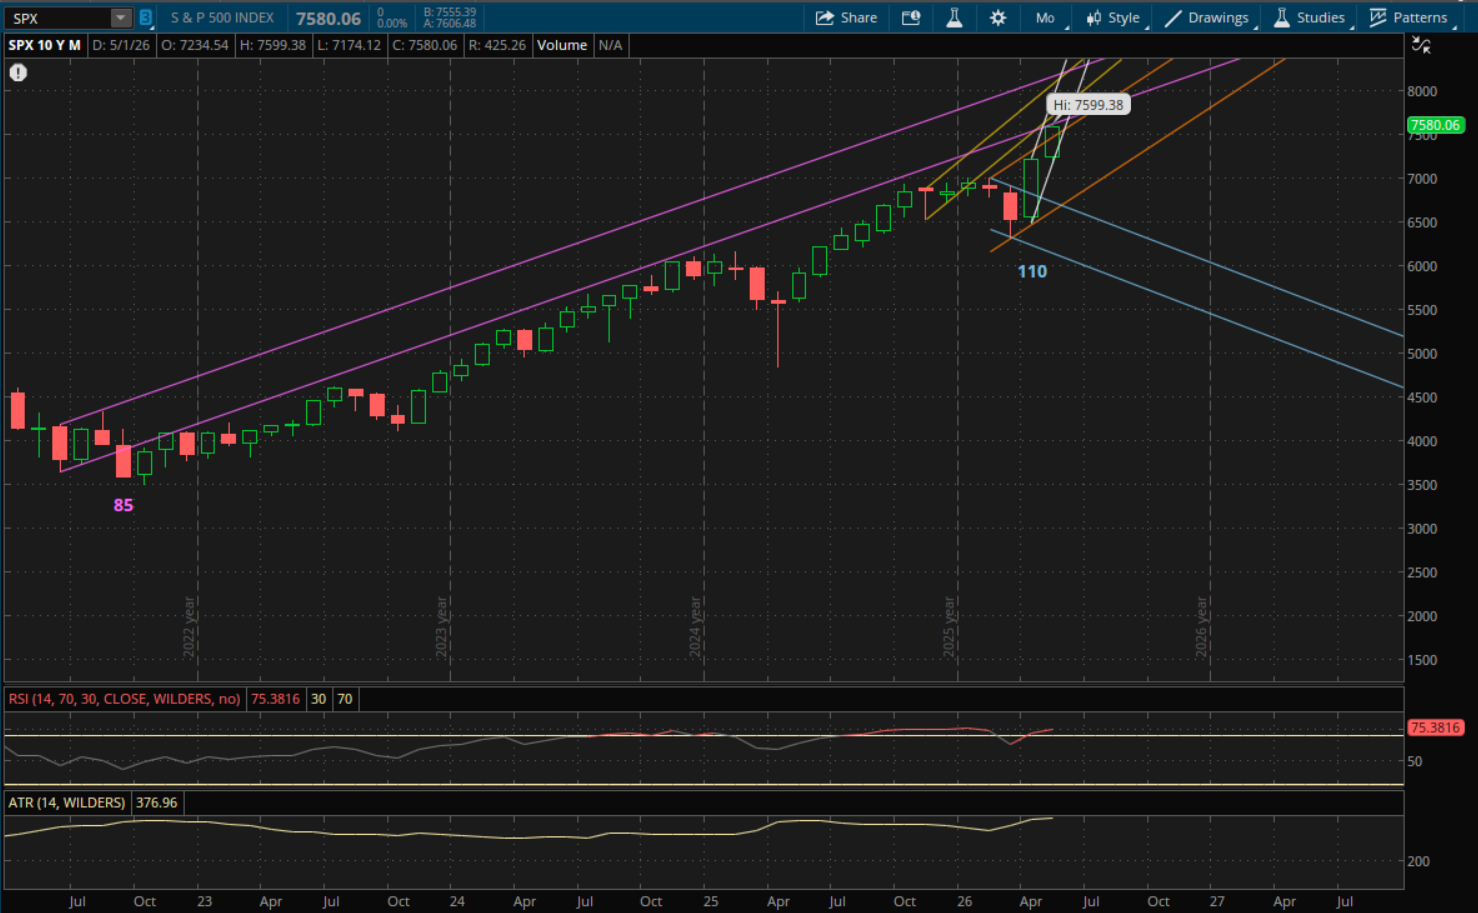
The S&P is in a similar situation as it also started a new monthly uptrend, but it's not going to open above this new primary trend (white) to start the month. That level will be right around 7,900 which is about 4% away, and we're not going to get a 4% gap up to open above it. So instead, it will be resistance on a continuation of this rally.
However, the first resistance to watch will be from its prior uptrend (orange) at about 7,630. This is about 0.7% away from Friday's close of 7,580. There is potential for a gap above it tomorrow, and if it does then it will act as support. But, odds are it will be resistance as well. After that, the next resistance will be from its next uptrend (purple) right around 7,700. Then its primary uptrend comes into play at 7,900 and its prior uptrend (yellow) will also be just above that around 7,920. There would be more resistance levels above 8,200 but it's unlikely we actually get there in June.
Now on a pullback, the first support to watch is very far from its prior uptrend (orange) at about 6,800. That's about 10% away from Friday's close of 7,580. It's unlikely it gets tested without a big catalyst. The more likely scenario would be that it simply starts a new primary trend heading into July, but we'd have to wait and see how it finishes June first in order to determine the direction of that new trend.
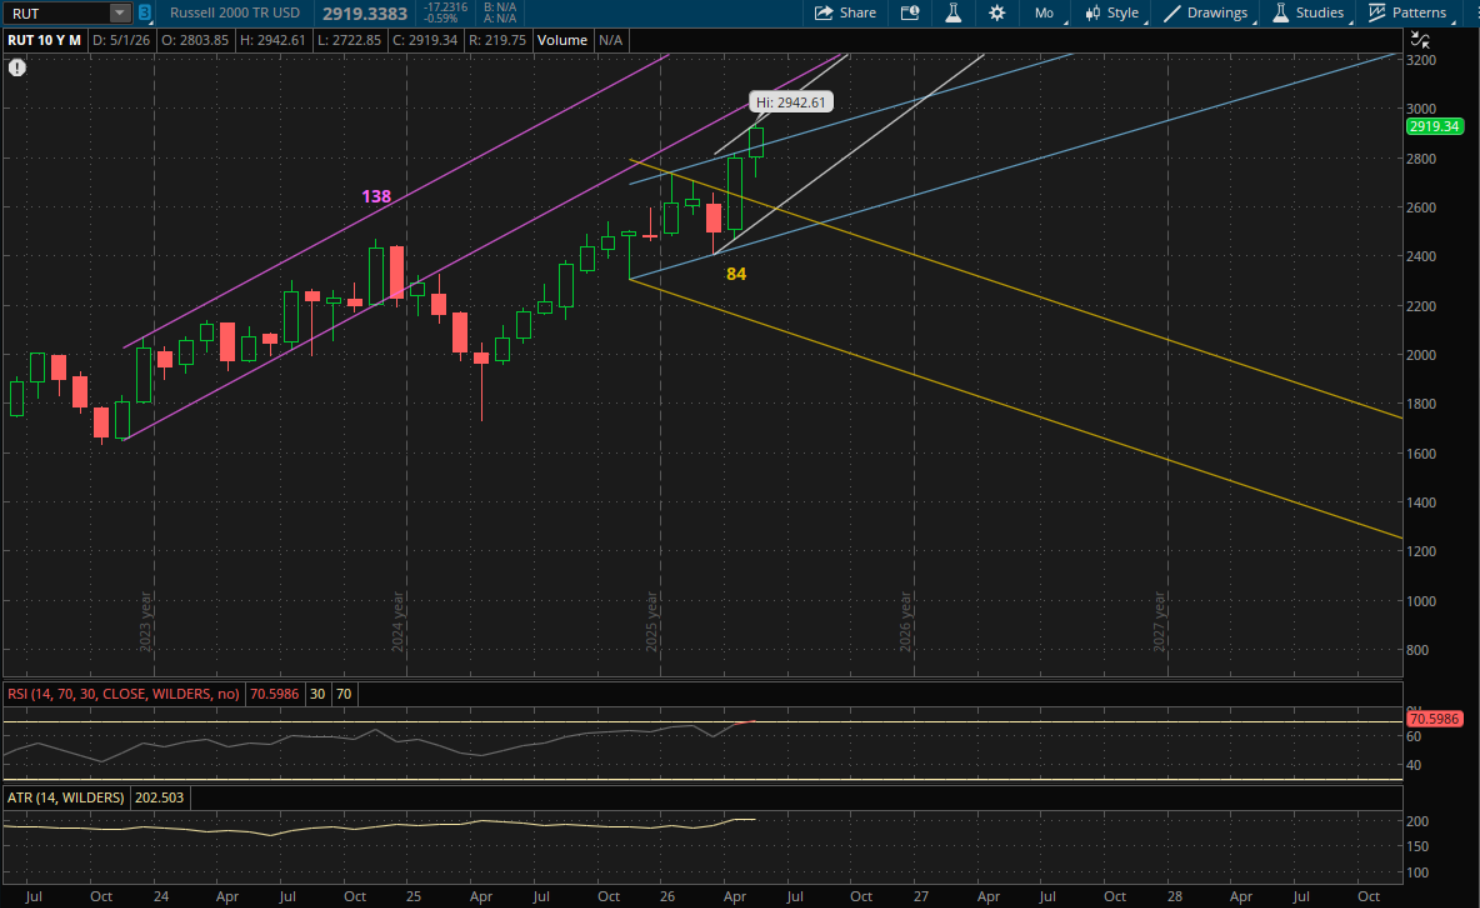
The Russell 2000 also started a new uptrend with a close above last month's primary uptrend. However, just like with the S&P and Nasdaq, it's not going to get a big enough of a gap up to open above this new primary uptrend (white) which will be at 3,005-3,010 in June. That's around 3% away from Friday's close of 2,919 That new primary uptrend (white) will be the first resistance level to watch on a continuation of this rally. If it breaks through it, then the last resistance will be from its prior uptrend (purple) at 3,080-3,085.
On a pullback, the first support to watch will be from its prior uptrend (blue) at about 2,870 which is less than 2% away. If that doesn't hold, the next support level to watch will be at 2,590-2,600 which is from both its primary uptrend (white) and its prior downtrend (yellow) where the two trends intersect. This would also be a big sell-off of 10-12% and would require some major catalyst for it to actually get there.