The Nasdaq was the best performing index in August, posting a monthly gain of 3.9%, while the S&P added 2.6% and reached new all time highs. Small caps were the worst performing as yields continued to rise into the end of August and nearly hit highs for the year. The Russell 2000 still did post a monthly gain of 0.85%, but it finished near the lows of the month. The VIX did hit new lows for the year and nearly broke below $14 before settling at $14.92 for a monthly decline of 6.7%.
In September there will be some key economic data to watch for starting with the August jobs report which comes out this Friday. After the jobs report, there will be CPI on Wednesday, September 11th, which will be the last piece of inflation data before the Fed's next rate decision on September 16th. The rate decision will be the biggest catalyst for the month and the jobs report and CPI data will be the two big sets of economic data that the Fed will be watching leading up to their rate decision. Odds have shifted towards a rate hike after last week's speech by Kevin Warsh at Jackson Hole. Currently the odds are in favor of a 25bps hike in September with about a 64% probability while no change sits at 36%. Odds have also shifted for another hike in December.
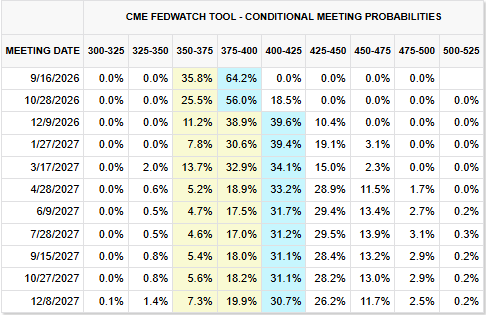
Source: CME
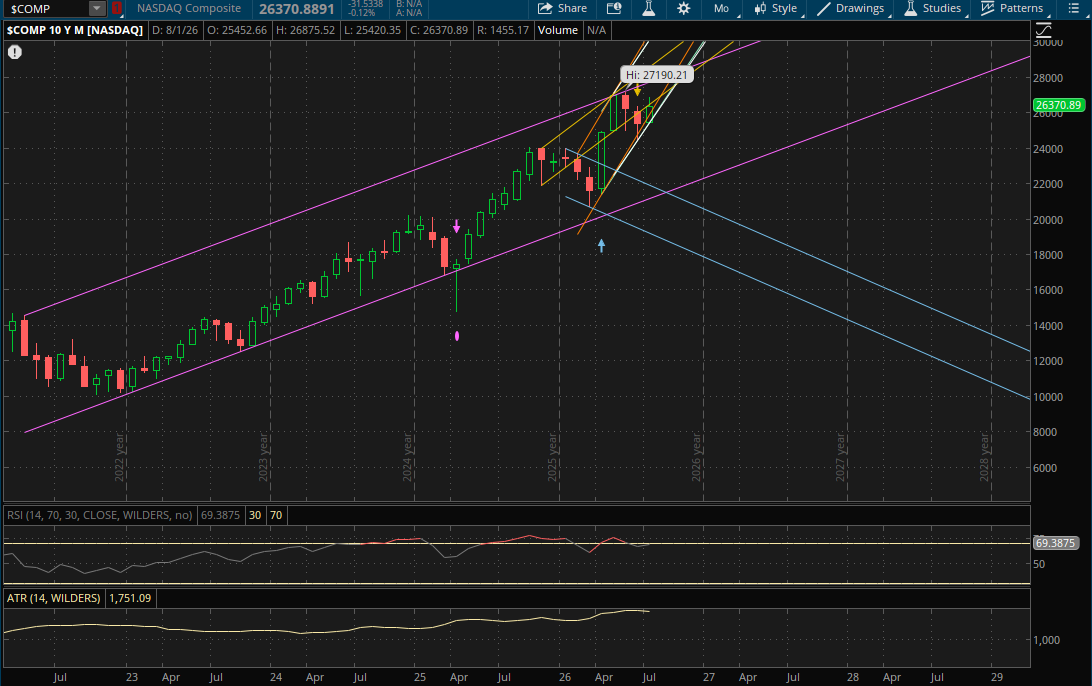
Looking at the technical setup going into September, the Nasdaq had a failed breakdown in August. It broke just a hair below its previous primary uptrend support and closed well above it which starts another monthly uptrend for it heading into September. The problem right now is that there will be risk of opening below its new primary uptrend (white) tomorrow along with its prior uptrend (green). These will be the first 2 key levels to watch around 26,425 (white) and 26,450 (green). Both of these levels are above today's close of 26,370. They aren't far, the 26,450 level is only about 0.3% away which the Nasdaq could potentially gap above tomorrow. If it can get this gap up above those levels, they will both act as supports on a pullback. From there on a rally in September, the next monthly resistance to watch will be right around 27,000 from its prior uptrend (yellow). There will be more monthly resistance just above that from its next uptrend (orange) around 27,050. If it can break through both of those, the last monthly resistance that likely comes into play would be from its long term uptrend (purple) around 27,950-27,975.
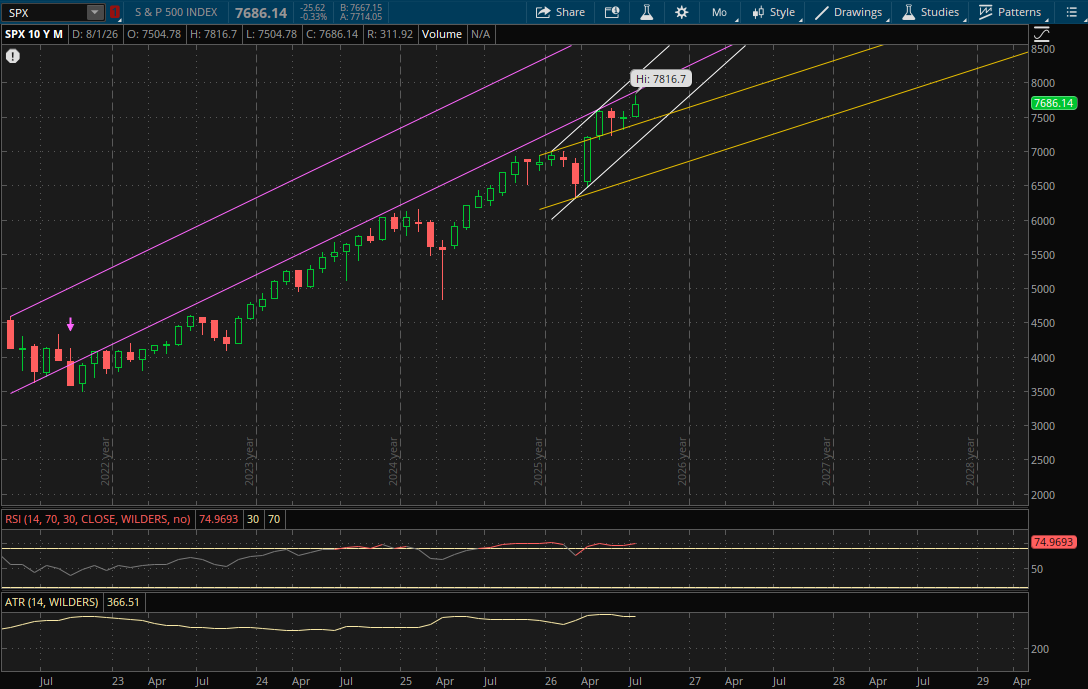
The S&P remained within its primary monthly uptrend so it doesn't start any new ranges for September. The first resistance to watch for next month will be around 7,950-7,960 from its long term uptrend (purple) which it continues to get rejected near and has yet to invalidate. If it can break through it, its last monthly resistance will be from its primary uptrend (white) at about 8,270.
On a pullback next month, the first support to watch will be from its prior uptrend (yellow) at 7,450-7,460. Note that I have been looking for a pullback near the 7,400 level with the weekly breakdown that it recently had (see the weekly updates). So this would be a big area to watch for on both weekly and monthly time frames. If the 7,450-7,460 support doesn't hold, then the last monthly support to watch will be from its primary uptrend (white) around 7,275.
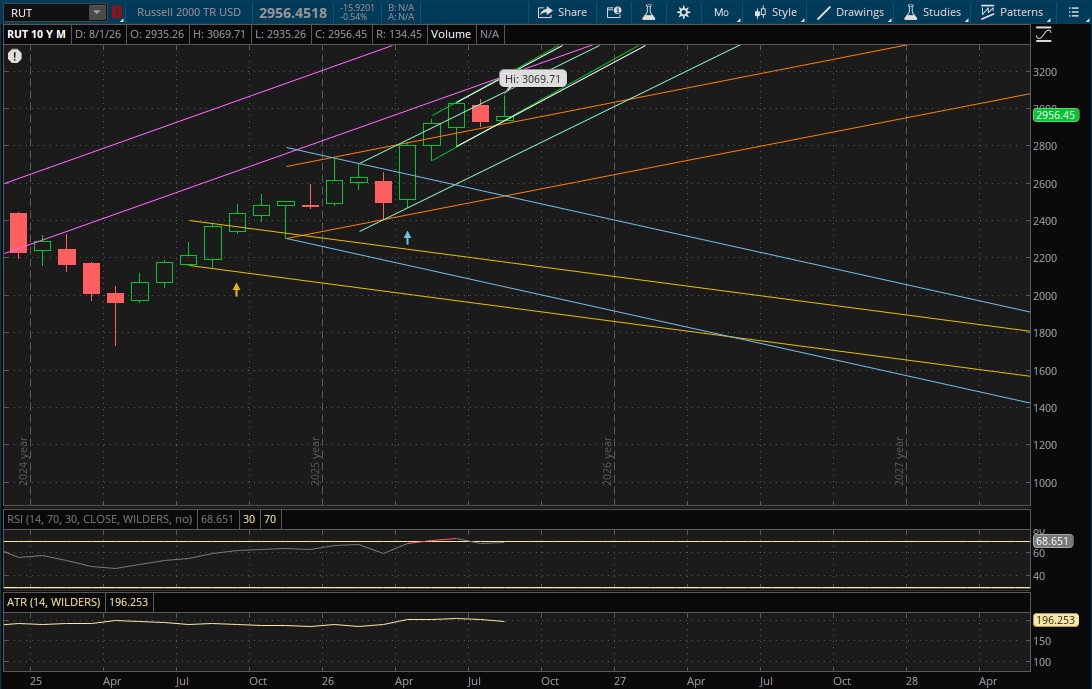
The Russell 2000 also had a failed breakdown last month, similar to the Nasdaq, which also starts a new monthly uptrend for it heading into September. However, it was a very weak finish for the Russell in August near the lows of the month and it will likely open below its new primary uptrend (white) tomorrow. That level will be at about 3,005 with its next uptrend (green) from August's failed breakdown being just above it at about 3,015. Both of these will be the first resistances to watch in September assuming there is no gap above them tomorrow. The Russell 2000 closed at 2,956, so they are nearly 2% away, in all likelihood they will be resistance and they'll be the only monthly resistances that come into play.
On a continuation of the pullback we've had recently in small caps, the first support to watch will be from its prior uptrend (orange) at about 2,945. This is only about 0.4% away from today's close of 2,956, so there is risk of a gap below it tomorrow. If that were to happen, the 2,945 area would then become resistance as well. After that, the last support to watch on a sell-off would be around 2,790 from its next uptrend (teal) which is about another 5.5% away.