The U.S. continued its strikes against Iran today, sending oil higher by nearly 6%. Oil settled above $90/barrel, reaching its highest level since late July. The sharp jump in oil also added to inflation fears again which sent treasury yields higher. The 10 year yield hit a new high for the year again, reaching 4.797%, and it's now just off of the 2025 high of 4.809%. This once again hit rate sensitive small caps the most with the Russell 2000 closing down 1.23%. The Nasdaq lost another 1.03% while the S&P closed down 0.71%. The VIX finally caught a bid with today's sell-off as it closed up 9.5% at $16.34.
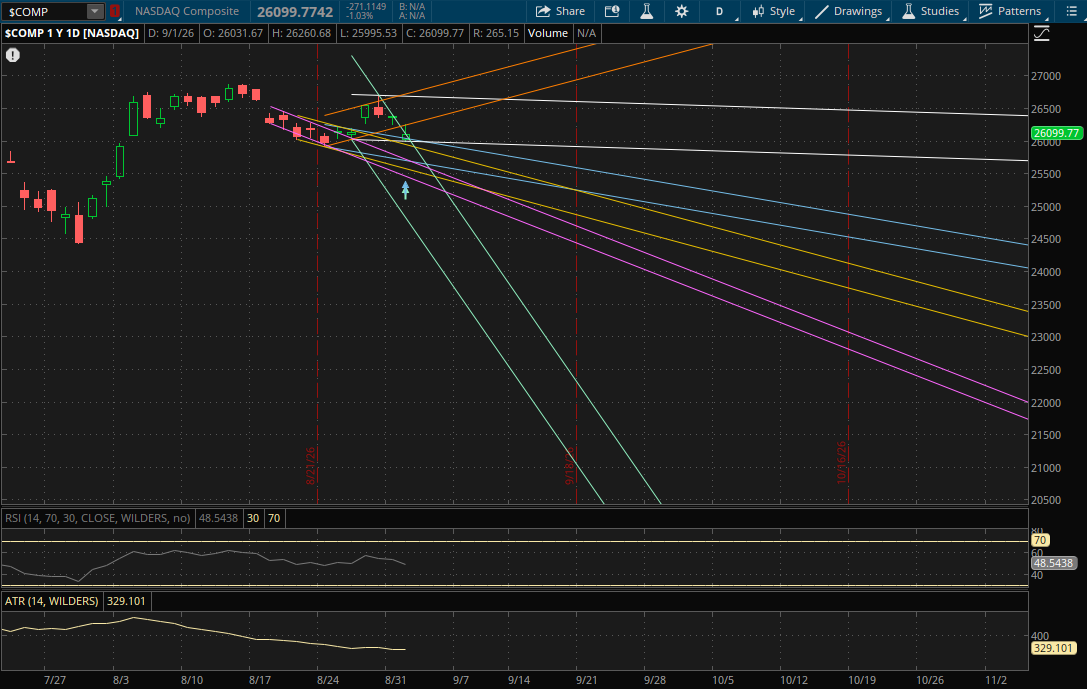
The Nasdaq actually had a big gap down this morning below yesterday's primary downtrend support despite the strong finish yesterday. It did rally back into the close to finish just above it, however it starts a new downtrend with today's lower low that it made. For tomorrow, the only daily resistance level to watch will be from its prior uptrend (orange) right around 26,300 on a rally attempt. It got rejected at this prior uptrend today and will continue to act as resistance for now.
On another pullback, the first support to watch will be at its prior downtrend (blue) just above 26,000. If that doesn't hold, its primary downtrend (white) will be the next support to watch at about 25,990. After that, its next downtrend (yellow) will be support around 25,890 followed by its next downtrend (teal) around 25,790. If none of those hold, the last supports will come at about 25,650 (blue) and 25,640 (purple). There is a possibility that we see another big gap down, if it does gap below any of these supports then they will become resistance instead.
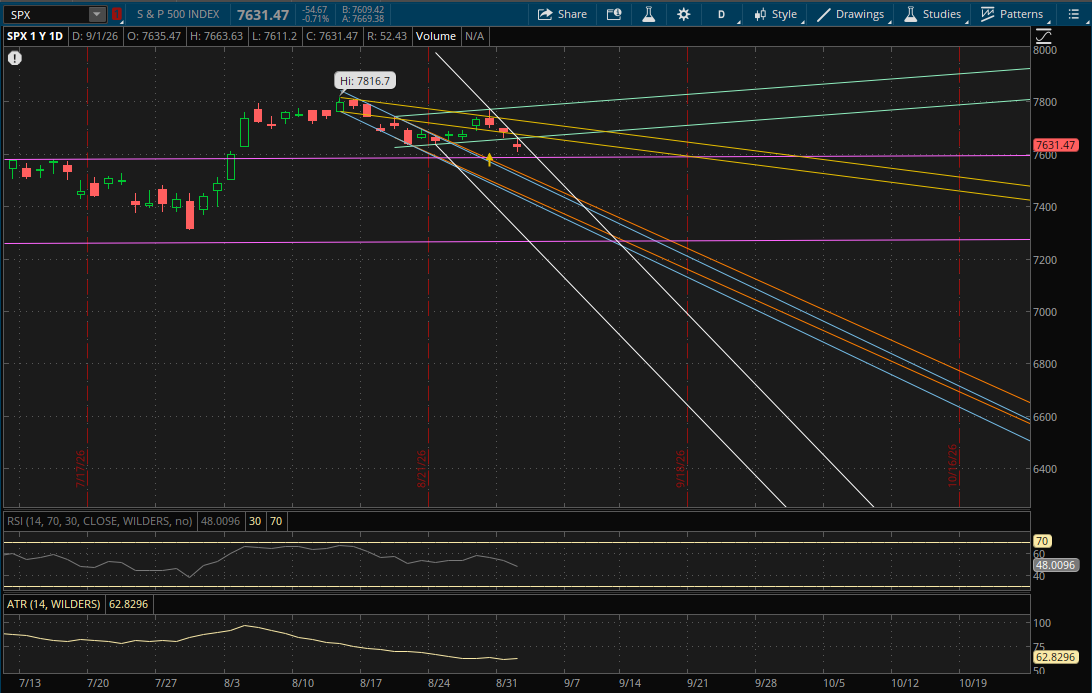
The S&P also gapped below its primary downtrend from yesterday and got rejected right around it at the 7,662 level on the early rally attempt, hitting a high of 7,663.63. It closed well below it which starts a new primary downtrend for it. For tomorrow, this primary downtrend (white) will be the first key level to watch at about 7,610. The S&P closed at 7,631 today, so as long as there is no big gap down again tomorrow, the 7,610 area will act as support on a pullback. From there on a rally attempt, the next resistance to watch will be at about 7,666 from its prior uptrend (green) which it got rejected at today. If it breaks this time, then the last resistance will be just above that at about 7,670 from its prior downtrend (yellow).
If there is another big gap down below its primary downtrend around 7,610 tomorrow then that area becomes resistance. After that, the next support to watch on a continuation of this pullback will be at about 7,587 from its prior sideways range (purple). If that doesn't hold then its last two daily supports will be at 7,510 (orange) and 7,495 (blue). I did enter SPY put calendar spreads today after it got rejected at yesterday's primary range and for now I remain bearish and am looking for further downside (see the weekly update).
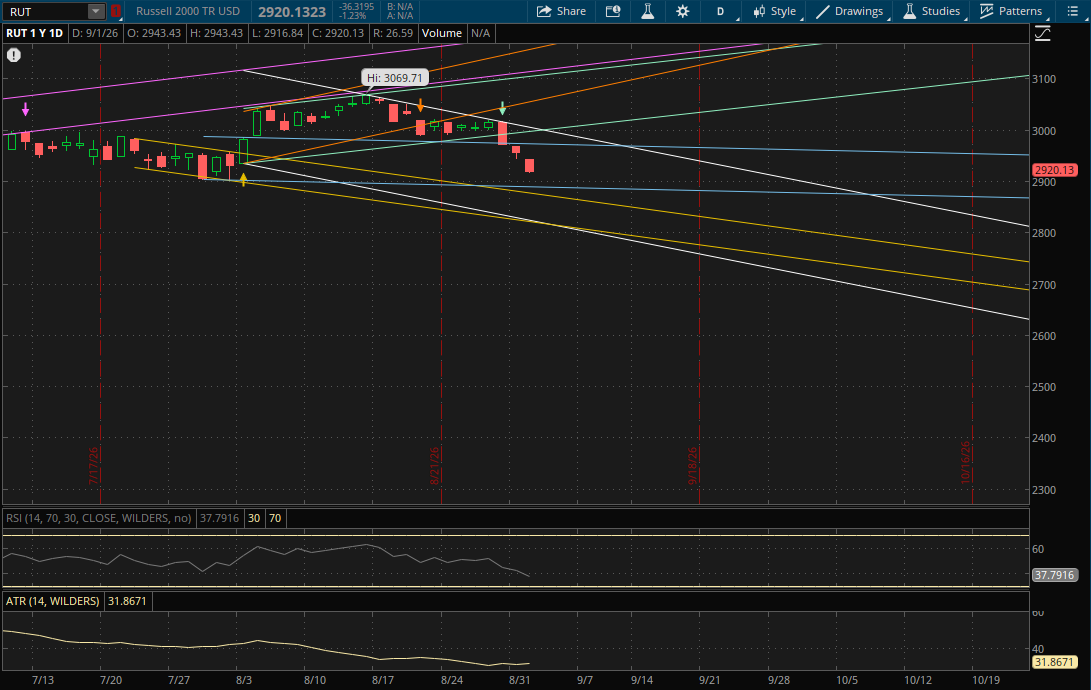
The Russell 2000 continued to trade down within its big primary downtrend, so it doesn't start any new daily ranges for tomorrow. On a bounce, the only resistance that likely comes into play will be from its prior downtrend (blue) around 2,973.
On a continuation of the sell-off, Its first support will also be from this downtrend (blue - bottom of the range) at 2,889-2,890. If that doesn't hold, the next daily support will be at 2,874-2,875 from its next downtrend (yellow). After that, its primary downtrend (white) and prior downtrend (yellow - bottom of the range) will both be support at 2,818-2,820 in the event of a big sell-off.