The markets bounced back a bit today as oil pulled back off of its highs and finished the day down 0.4%. The 10 year treasury yield hit 4.809% which was the high of 2025 before it also pulled back a bit to finish flat at 4.79%. The Russell 2000, which has gotten hit the hardest recently, led in today's session as it closed higher by 1.13% while the Nasdaq and S&P both gained about 0.45%. The VIX got crushed again with the bounce in markets today, closing down about 7% at $15.20.
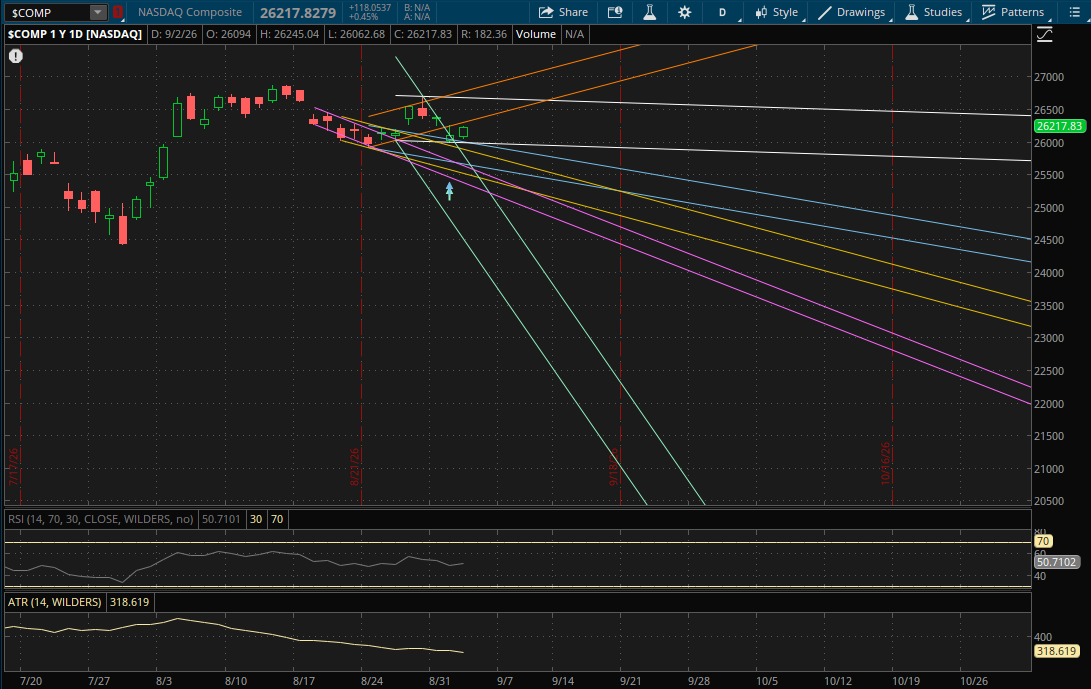
There was no big gap down this morning so the Nasdaq was able to open above the primary downtrend that it started yesterday, which led to this technical bounce. It didn't break through its primary downtrend so it doesn't start any new daily ranges for tomorrow. The only resistance in play for tomorrow will again be from its prior uptrend (orange) at 26,350-26,360.
If we get another pullback, the first support to watch will be from its primary downtrend (white) at about 25,980 with more just under that from its prior downtrend (blue) around 25,975. Its primary weekly uptrend (see the weekly update) will also be right around there at 25,970-25,980. So that area will be a big support from both daily ranges and its weekly uptrend support.
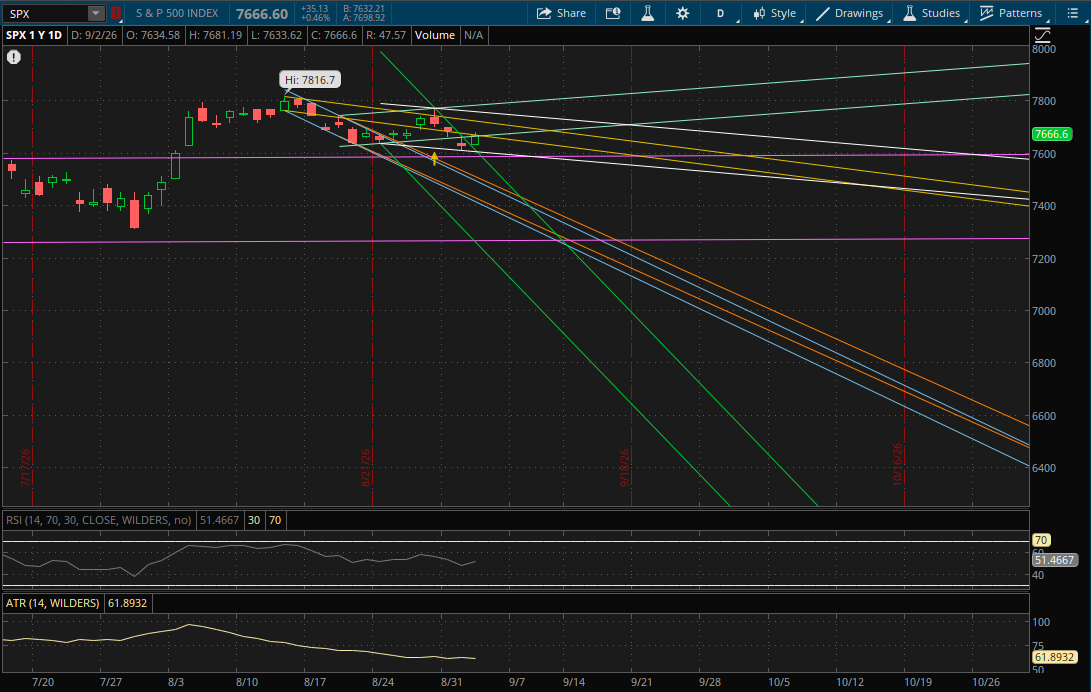
The S&P also opened above yesterday's primary downtrend and rallied to break above its next 2 daily resistances at 7,665-7,670. However it closed right in that range at 7,666.60. With today's close above yesterday's downtrend, a new primary downtrend begins as it is coming off of lower lows.
For tomorrow, the first level to watch will be at 7,663 from its prior downtrend (yellow) followed by 7,670 from its prior uptrend (teal). It broke above these 2 trends today, but didn't close above them or invalidate them. So they will continue to be resistance if the S&P opens below it again. The S&P closed at 7,666.60 so it is possible that it gaps above them in which case they'll act as support. If that happens, the next resistance to watch on another rally attempt will be at 7,715 from the top of its prior downtrend (yellow).
If the S&P fails to open above 7,663 tomorrow, both of those prior trends will continue to act as resistance. On another pullback, the next support to watch will be from its primary downtrend (white) right around 7,600. If it doesn't hold, it will have more support from its prior sideways range (purple) at about 7,588. Its last daily support would be at about 7,555 from its next downtrend (green) which it opened and closed above today.
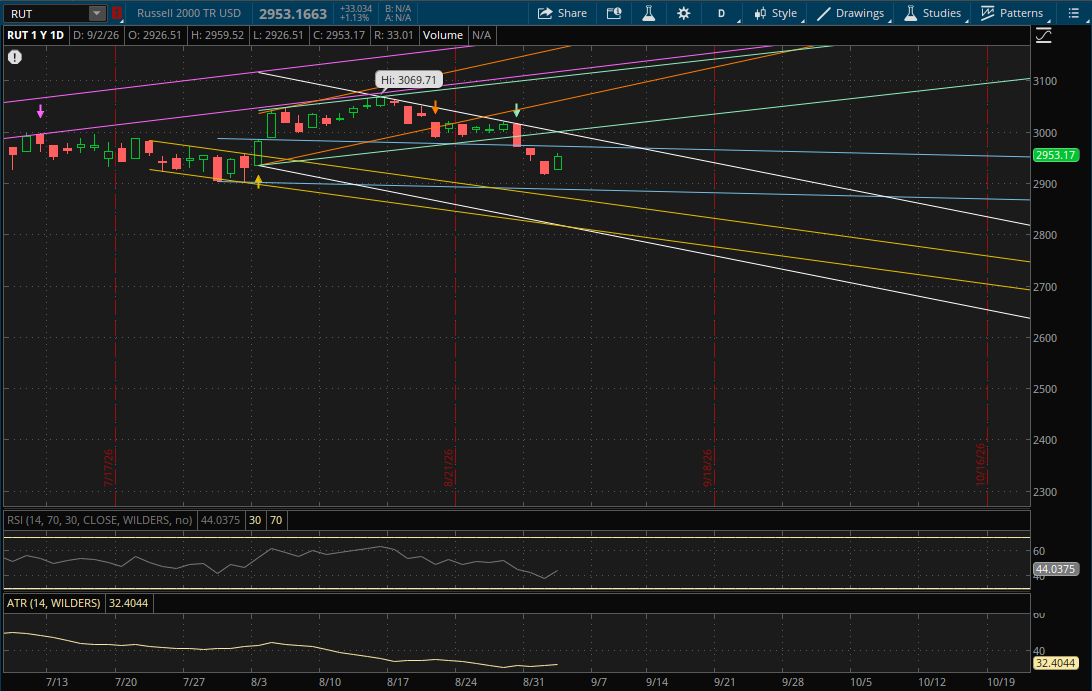
The Russell 2000 continues to trade within its big primary downtrend (white) so it doesn't start any new ranges again. The first resistance to watch on a continuation of the bounce will again be from its prior downtrend (blue) at about 2,972. If it breaks through it, its primary downtrend (white) would be next at 2,995. The last daily resistance to watch would be from its prior uptrend (green) at about 3,004 if there's another big rally.
If we resume the pullback, the next support to watch will be at about 2,888 from its prior downtrend (blue - bottom of the range) followed by 2,870 from its next downtrend (yellow). There would be more support at about 2,815 from both its primary downtrend (white) and its prior downtrend (yellow - bottom of the range) in the event of a big sell-off.