The jobs report on Friday came in much better than expected as the U.S. added 162,000 jobs in August vs the estimate of 53,000 while unemployment remained unchanged at 4.1% which was in line with expectations. However the markets fell on this strong report as a stronger labor market increases the odds of a rate hike since the economy can handle it. On Thursday the odds of a rate hike fell after Fed Governor Christopher Waller said that he would be in favor of no change in the upcoming September meeting. But after yesterday's strong jobs report, the odds moved back in favor of a 25bps hike with about a 60% probability while no change sits at 40%.
Yields spiked after the hotter than expected jobs report yesterday with the 10 year treasury yield hitting a high of 4.814% which broke the 2025 high of 4.809%. Although it did pull back by the end of the day to finish pretty flat at 4.77%. Stocks for the most part reacted negatively with the S&P falling 0.38% while the Nasdaq lost 0.29%. On the other hand, the Russell 2000 closed higher by 0.25%. Small caps have outperformed in the last few sessions after underperforming over the past few weeks with the Russell pulling back 5% off of its all time high. The VIX broke below $14 in the morning, hitting a low of $13.80, before finishing higher by about 1.5% at $14.53. It hit its lowest level since December of 2025 before its late day recovery.
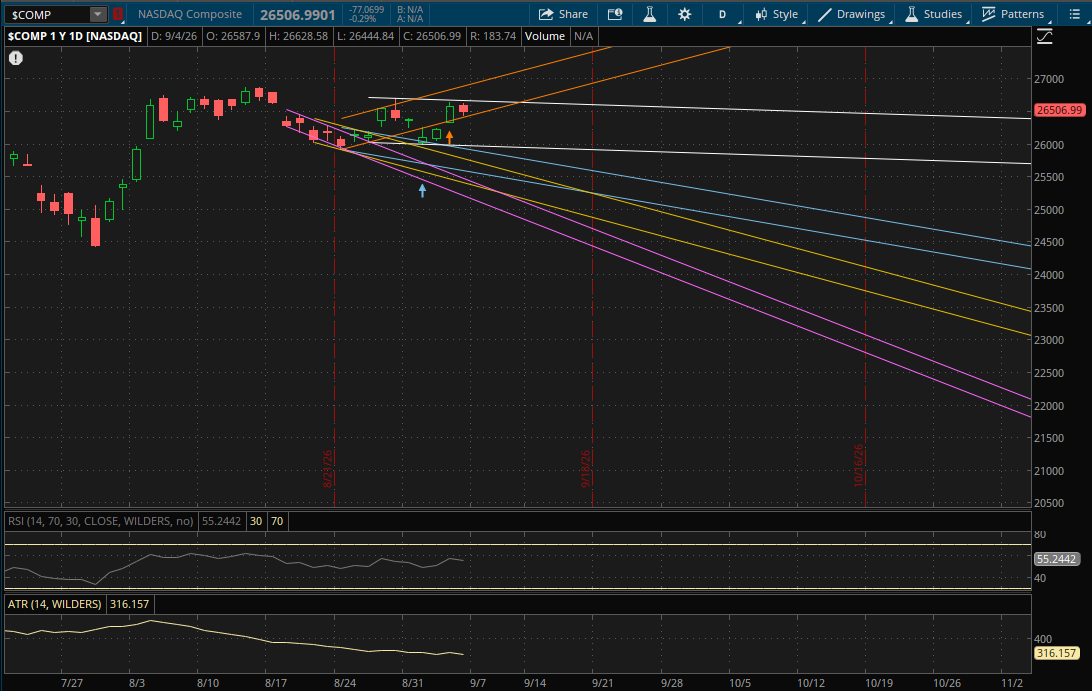
The Nasdaq gapped down yesterday and didn't break through its primary downtrend, so it doesn't start any new daily ranges for Tuesday (markets are closed on Monday for Labor Day). So for Tuesday, its primary downtrend (white) will be the first resistance to watch again at 26,660-26,670 on another rally attempt. If it breaks through this time, the last resistance will be from its prior uptrend (orange) at about 26,940.
On another pullback, its prior uptrend (orange) which it held yesterday will again be the first support to watch at about 26,470. If it doesn't hold and we get a larger sell-off then its primary downtrend (white) will be the next support to watch at around 25,975. If that doesn't hold, it will have more from its next downtrend (blue) just below it around 25,940.
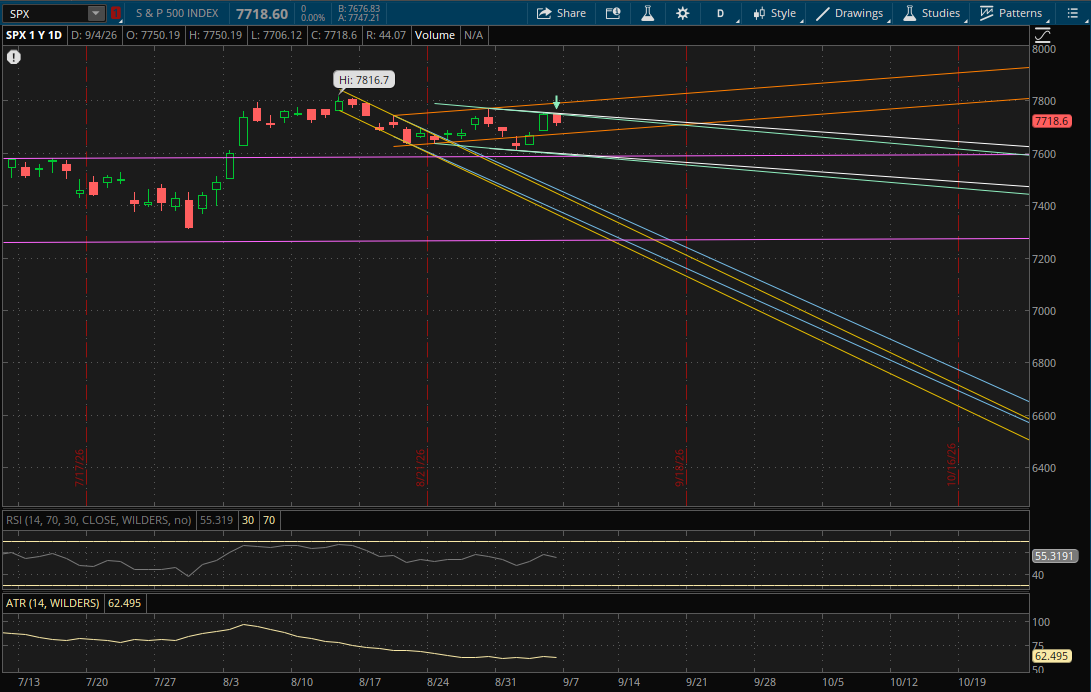
The S&P also failed to gap above its primary downtrend yesterday, and it didn't break through it either, so it doesn't start any new daily trends for Tuesday. The first resistance to watch will be from Thursday's failed breakout (green) at about 7,745. Its primary downtrend (white) would be the next resistance just above that at about 7,750. If it breaks through both of those, the last resistance to watch will be from its prior uptrend (orange) at about 7,795.
On another pullback, its prior uptrend (orange) will be the first support to watch at about 7,678. If that doesn't hold, its next supports are farther away at 7,596 (white - primary downtrend) with the next support (green) at about 7,593. The last support to watch would then be from its prior sideways range (purple) at about 7,588 if we get a larger sell-off.
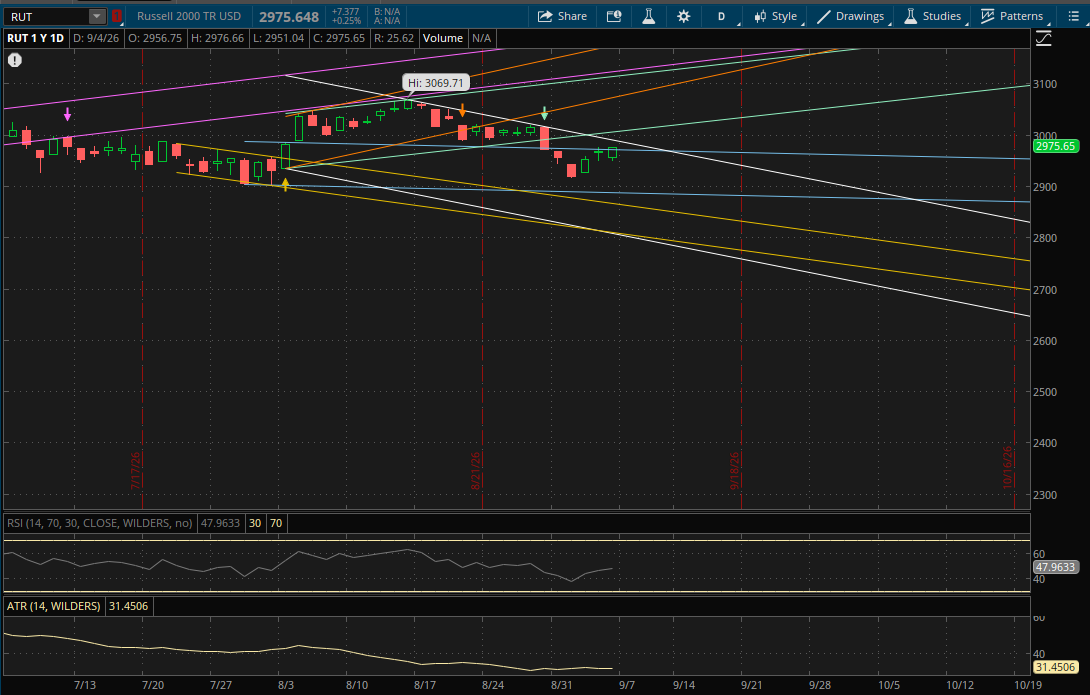
The Russell 2000 had a strong finish near the highs of the day, but it didn't break through its primary downtrend so it also doesn't start any new daily ranges here. The first level to watch for Tuesday will be from its prior downtrend (blue) at about 2,970. The Russell closed at 2,975 yesterday, so as long as it opens above 2,970 on Tuesday, that downtrend will act as support. From there, its next resistance will be at its primary downtrend (white) at about 2,985. If it can break through that, the last resistance to watch will be from its prior uptrend (green) at 3,010.
If it fails to open above that prior downtrend (blue) around 2,970 it will act as resistance again. From there on a pullback, the only support that potentially comes into play will be from this same downtrend (bottom of the range) at 2,885-2,890 if we get a bigger sell-off.