The markets pulled back in the first half of the week but they clawed their way back to post minor gains for the week. Tech led with the Nasdaq posting a weekly gain of 0.4% while the S&P and Russell 2000 added about 0.1%. The VIX continued its sell-off, hitting a low of $13.80, its lowest level since December 2025. But it did climb back into the close on Friday and finished the week up 0.70% at $14.53.
On Monday, September 7th, the markets will be closed for the Labor Day holiday. So we will be going into a short 4 day trading week after the long weekend. There will be 2 inflation data points this week with PPI on Thursday and then the big one - CPI on Friday. Fed Governor Christopher Wallace said on Thursday that he would be in favor of holding rates steady at the September meeting as long as these next couple of inflation readings don't come in hot. These will be the last 2 big data points for the Fed to consider before their next rate decision on September 16th.
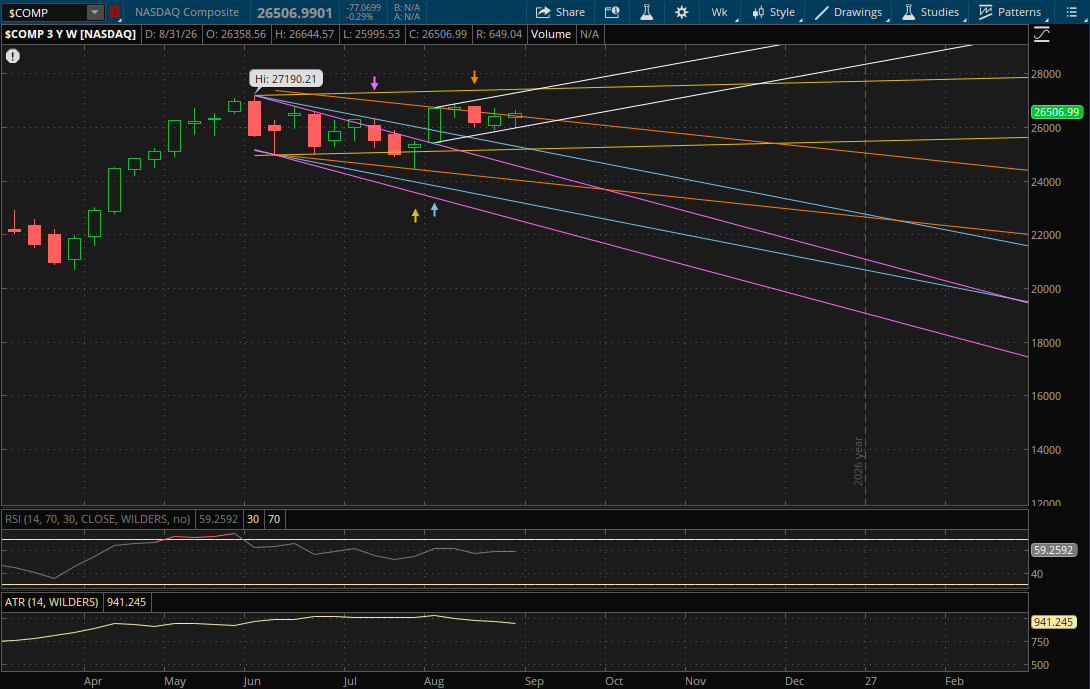
Looking at the technical setup, the Nasdaq once again held its primary weekly uptrend support on the early pullback in the first half of the week. So it doesn't start any new trends again. It also closed back over its prior downtrend (orange) but hasn't invalidated it yet. So this downtrend (orange) will now act as support around 26,350 as long as we don't get a gap back underneath it to start the week. The Nasdaq closed at 26,506 so it's about 0.6% away. So assuming it does open above it, then we set up for a rally with the next big weekly resistance at 27,425-27,450 from both its primary uptrend (white) and prior uptrend (yellow) where the 2 trends intersect.
If the Nasdaq does gap back underneath its prior downtrend (orange) around 26,350 then this downtrend will act as resistance again. It's possible that it also just breaks through it even if it does open above it, and from there on a pullback the next support to watch will be at its primary uptrend (white) again around 26,100. It held this primary uptrend over the last 2 weeks, but if it were to break down through it, the next supports would be farther away at about 25,215 (yellow) and 25,150 (blue).
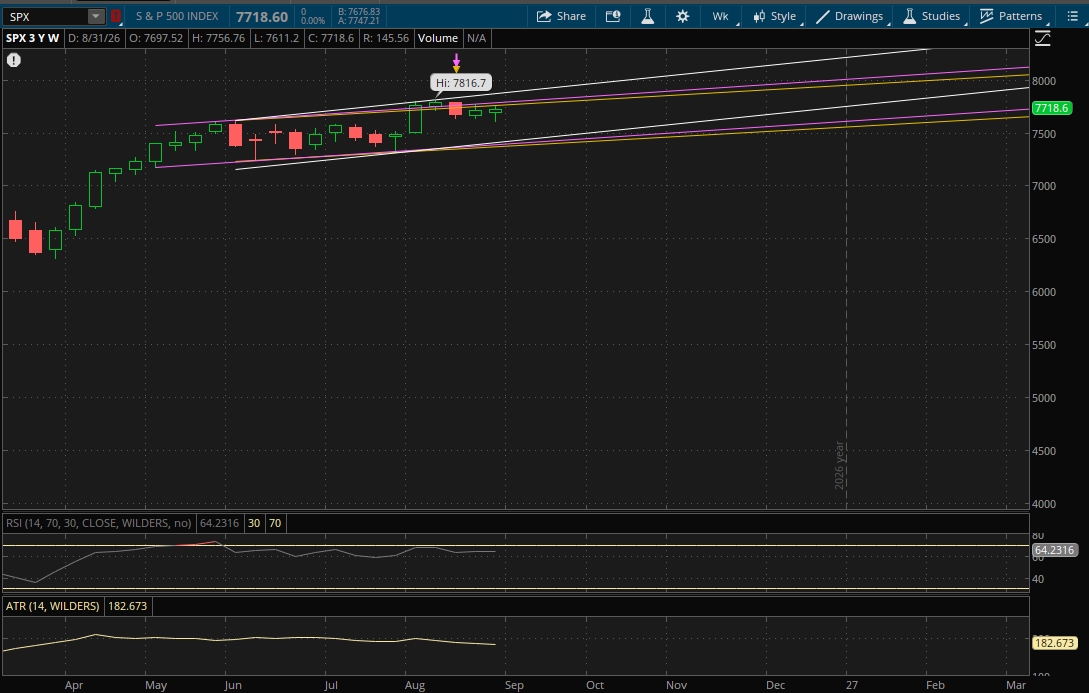
The S&P got rejected near its prior weekly uptrend (yellow) which was the first resistance I mentioned in last weekend's update at about 7,760. It didn't invalidate any of its prior uptrends and remains well within its primary uptrend (white) so it doesn't start any new weekly ranges for next week either.
On a rally next week, the first resistance to watch will continue to be from its prior uptrend (yellow) which will be a bit higher at 7,775. If it breaks through it, the next resistance will be right around 7,800 from its next uptrend (purple). After that, its last weekly resistance will from its primary uptrend (white) at about 7,895.
If the pullback resumes, the next support to watch will be from its primary uptrend (white) at about 7,435. If that doesn't hold, the next supports will be from the next 2 uptrends at 7,405 (purple) and then 7,380 (yellow). While I have been looking for a pullback over the past couple of weeks down towards this 7,400 area, the dip continues to get bought and the pullback down to that level looks less and less likely. The longer it also takes, the worse the risk/reward becomes for a short as it's an uptrend and those support levels will continue to be higher.
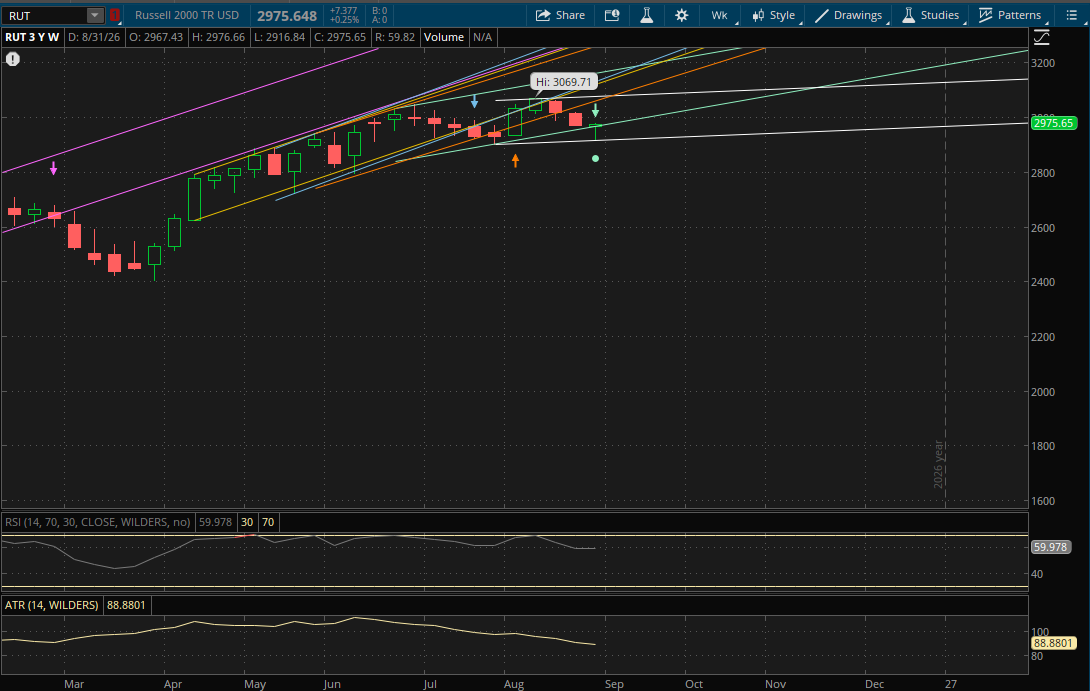
The weekly setup for the Russell 2000 is the most intriguing now. It had a big failed weekly breakdown (very bullish) this week and started a new primary sideways range (white). There is one caveat here - it has to gap up above 2,980 next week for this bullish failed breakdown to be an optimal setup. The 2,980 area will be where its prior uptrend (green) is from the weekly failed breakdown. If it can gap over it next week, that 2,980 level becomes support. Even if it breaks through it, an open above it is still what matters most. So if it can get this open above the 2,980 level to start next week it would be a very bullish setup and I would be looking to get long IWM calls. In this scenario, the next resistance to watch would be from its primary range (white) at about 3,080 with its next resistance at about 3,085 from its prior uptrend (orange). This level is about 3.5% away and would be new all time highs for it.
Now if the Russell 2000 fails to get that open above the retest of the weekly failed breakdown (green) at 2,980, then this level will continue to act as resistance for now. If this happens, it's no longer a good long setup which is why the open on Tuesday is so important. In this scenario, the only other support to watch on a continuation of the pullback would be from its new primary range (white) at about 2,920 which is just above this week's low of 2,916.84.