Yesterday morning we got the last CPI report before next week's Fed rate decision and it came in hotter than expected with core CPI rising 0.3% month-over-month vs the estimate of +0.2%. Futures were already higher leading up to the data yesterday morning, and after they initially did pull back on the hot print, they recovered and continued to push higher. Yields initially fell on the print with the 10 year treasury yield dipping back under 4.9%. However, yields climbed back throughout the session and closed around 4.95% which was near the highs of day. Oil did pull back a bit, closing down 2.4% and settling right around $100/barrel which may have helped markets rally.
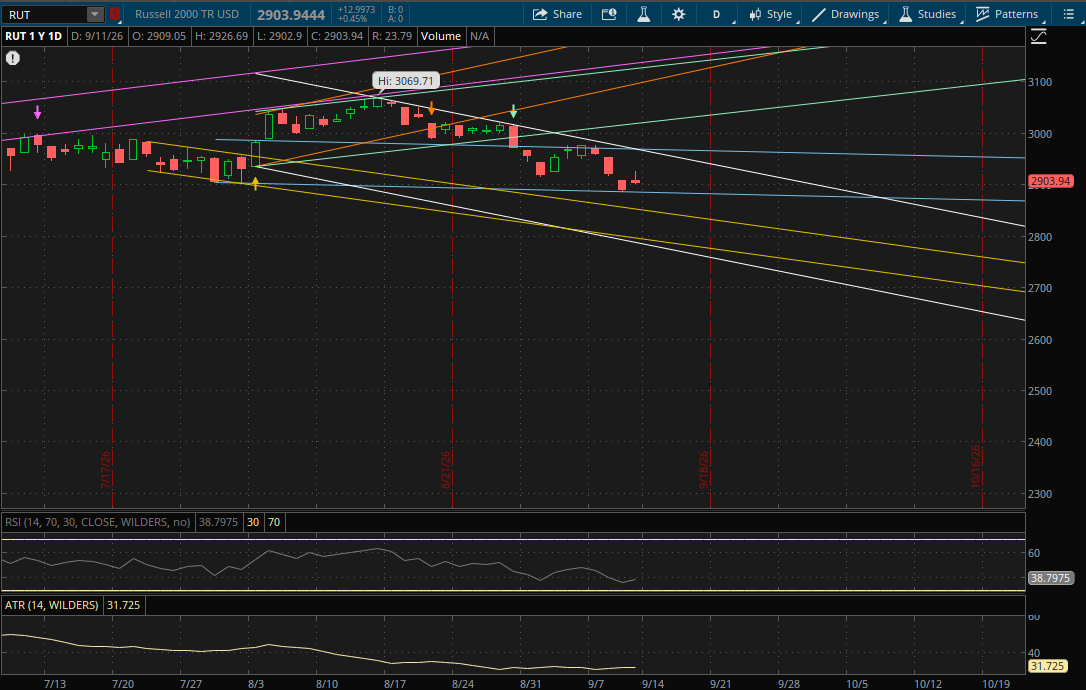
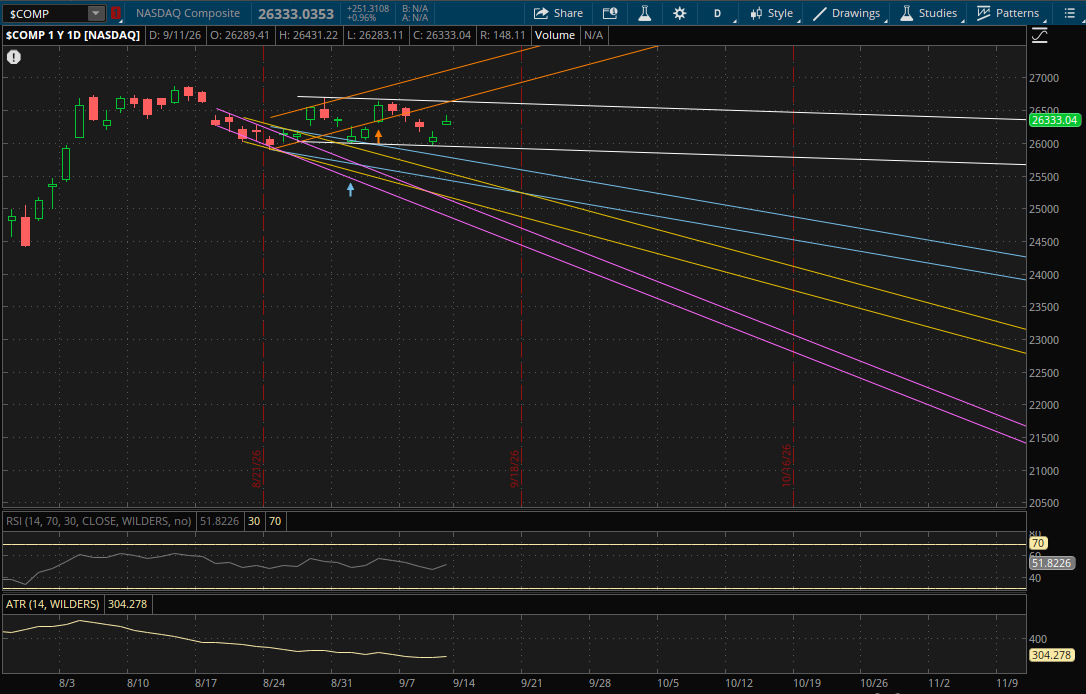
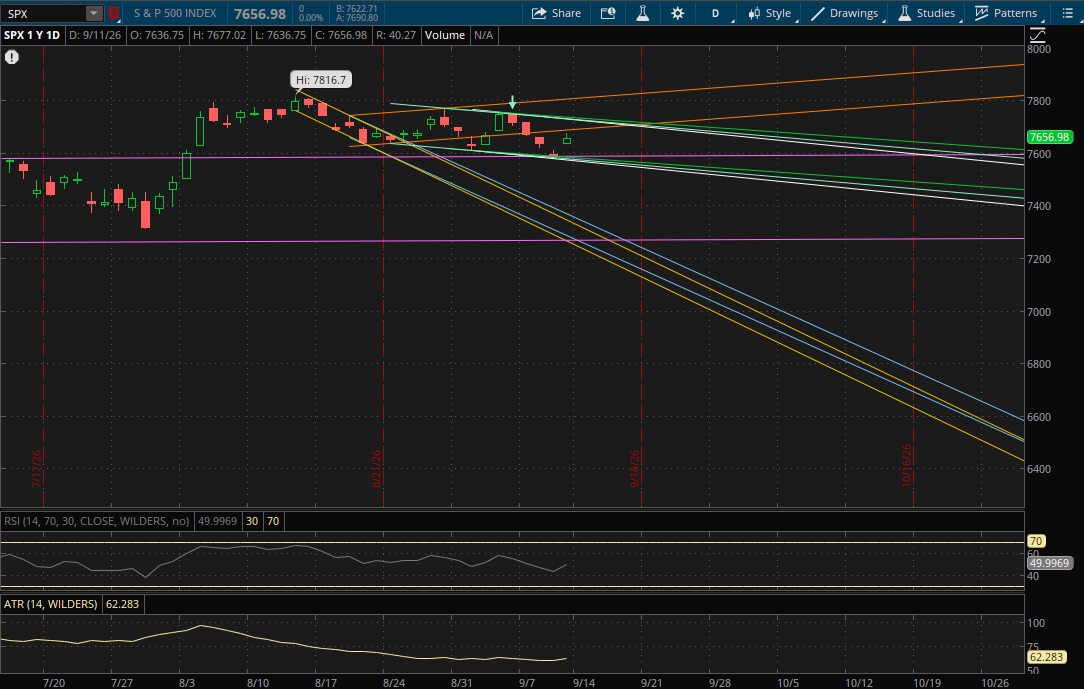
Tech led in the session with the Nasdaq closing up nearly 1% while the S&P added 0.86%. However the rally did fade a bit, especially in small caps as yields climbed back. The Russell 2000 finished at the lows of the day, but still posted a gain of 0.45%. The VIX got crushed again with the bounce back in markets, closing down 11.2% at $15.84.
The Nasdaq closed within its primary downtrend yesterday, so it doesn't start any new daily trends for Monday. Resistance to watch on another rally would be around 26,335 from its primary downtrend (white). If it breaks through, the last daily resistance in play would be from its prior uptrend (orange) around 26,685.
On another pullback, the first support to watch will be from its primary downtrend (white) at 25,940-25,950. If it doesn't hold, the last daily support likely to come into play would be from its prior downtrend (blue) at 25,750-25,760.
The S&P also traded in its primary downtrend, so it doesn't start any new daily trends either. The first resistance to watch on Monday on another rally attempt will be from its prior uptrend (orange) at 7,690-7,695. If it breaks through it, the next resistance will be at 7,725-7,726 from both its primary downtrend (white) and its prior downtrend (teal) where the 2 trends intersect. After that, there is only one more daily resistance to watch from its next downtrend (green) at about 7,735.
On a resumption of the pullback, the first support to watch will be from its prior sideways range (purple) at about 7,589. If that breaks it will have more support at 7,582 (green), 7,557 (teal), and finally 7,570 (white - primary downtrend).
The Russell 2000, which had the weakest finish, also continues to trade within its big primary downtrend so it won't start any new daily trends either. For Monday, this primary downtrend (white) will be the first resistance to watch at 2,964-2,965 on a rally attempt. If that breaks, the only other resistance that would potentially come into play would be from its prior downtrend (blue) at 2,968-2,969.
On another pullback, this same prior downtrend (blue) will be the first support level from the bottom of the range at 2,884-2,885. If that doesn't hold, its next downtrend (yellow) would likely be the last support in play at 2,848-2,849.