Oil spiked again today, gaining over 7% and settling near $104 which is its highest levels since mid-May. Yields also spiked with the 10 year yield finishing up over 2.2% at 4.944% which was the highs of day. The 10 year yield is quickly approaching 5% and the 2023 high which was 5.013%. The Russell 2000 was again the laggard, closing down 1.04%, as rising yields hurt the rate sensitive small cap index the most. The Nasdaq lost 0.65% while the S&P fell 0.58%. Volatility finally saw a bit of a bid with the VIX jumping 8.4% to settle at $17.84 and it did hold most of its gains today as the high was at $18.17. The VIX nearly went into backwardation again as well, but for now remains in contango. Historically, the VIX flipping into backwardation has been a bearish signal for markets as it's a sign that traders are expecting more near term volatility.
This morning we got PPI data which was rose 0.4% in August, in-line with estimates, while year-over-year PPI increased 5.4% vs the 5.3% estimate. However, core PPI rose 0.2% month-over-month, which was cooler than the 0.3% expectation. So all in all, the PPI data was essentially in-line with expectations. Tomorrow morning we will get CPI data, which is the bigger inflation data of the two that markets are waiting on, and month-over-month it is expected to increase by 0.4%. With today's move in oil and yields, the market continues to shift odds in favor of a rate hike for next week's meeting. Currently the market is pricing in a 25bps hike with a 71% probability while no change sits at 29%. This is up from about 50-50 just a couple of weeks ago.
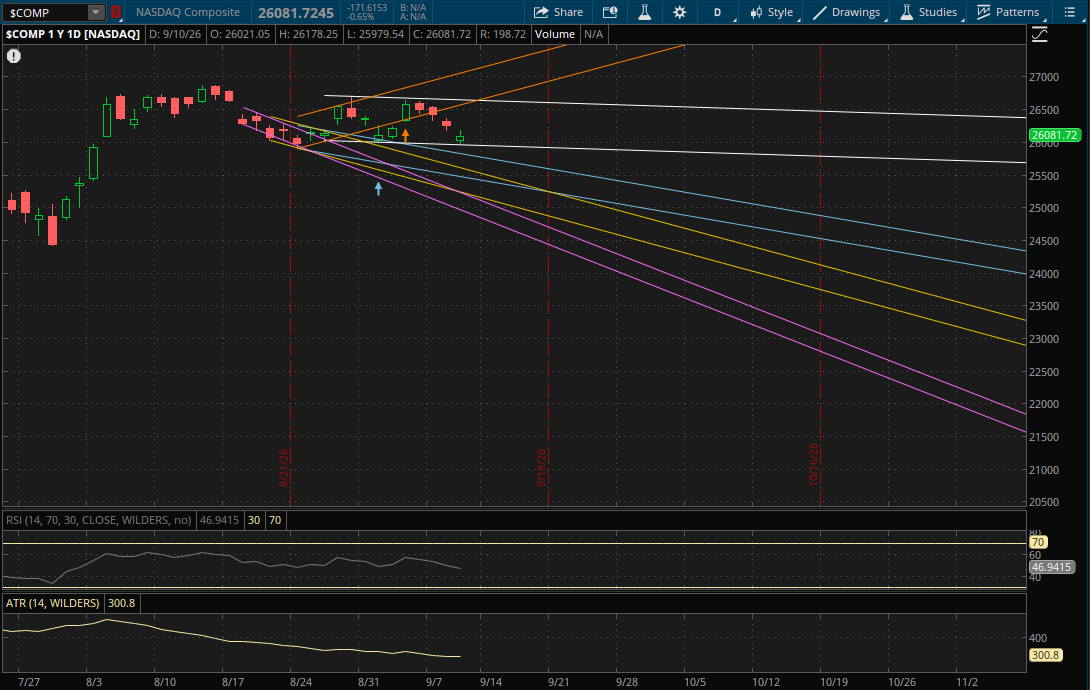
The Nasdaq gapped down this morning near its primary downtrend support (white) which didn't break, so it doesn't start any new trends for tomorrow. If we get a bounce back tomorrow, the only daily resistance to watch will be at 26,625-26,650 from both its prior uptrend (orange) and primary downtrend (white) where the 2 trends intersect.
On a continuation of the pullback, the first support to watch will be from its primary downtrend (white) around 25,950. If it breaks through it, or potentially gaps below it, then the next support will be from its prior downtrend (blue) just under 25,800. The last support potentially in play on a bigger sell-off would be from its next downtrend (yellow) around 25,550. It's also worth noting that the Nasdaq did break through its primary weekly uptrend support with today's sell-off (see the weekly update).
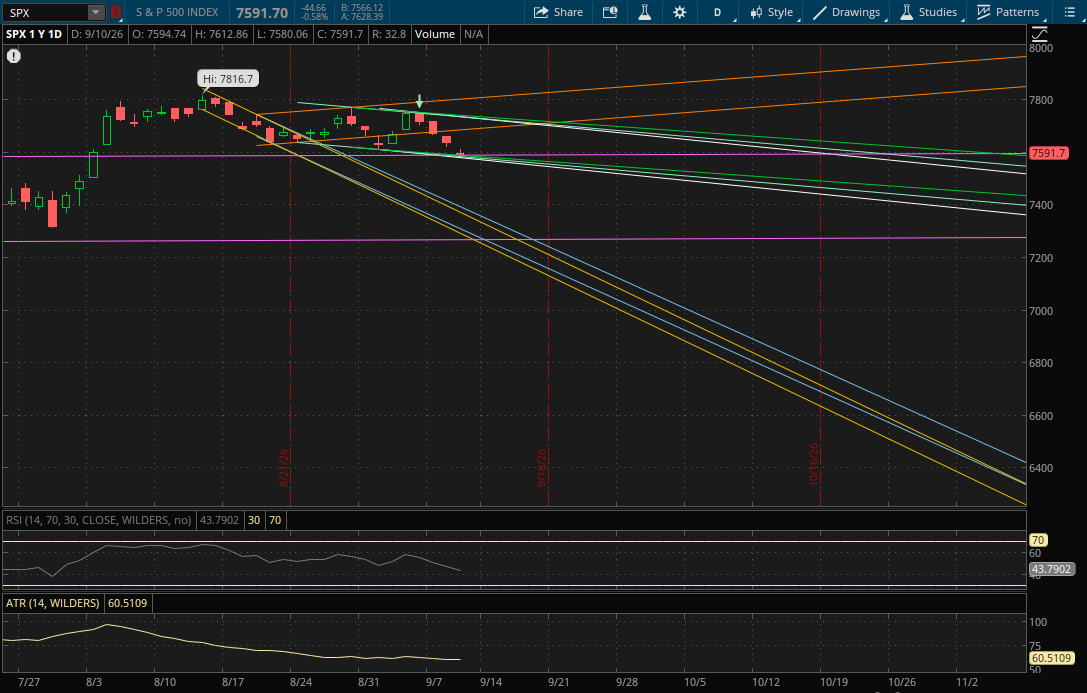
The S&P broke through its primary downtrend support this morning but did close back over it for a failed breakdown. However it made a lower low so it still starts a new downtrend here, but that new downtrend will be an added level of support for now. On a bounce back tomorrow, the first resistance to watch will be from its prior uptrend (orange) at about 7,690 which is likely the only resistance that comes into play as it's about 1.3% away. But, if we were to get a bigger rally then there would be more resistance at 7,730-7,740 from its primary downtrend (white) and next 2 downtrends (teal and green).
On a pullback, the first support to watch will be from the prior sideways range (purple) at 7,589-7,590 which is just below today's close of 7,591.70. After that it will have more support at 7,585 (green), 7,580 (teal), and finally 7,575 (white - primary downtrend). It is possible that it gaps below all of these on the CPI data, if that were to happen they would end up being resistance.
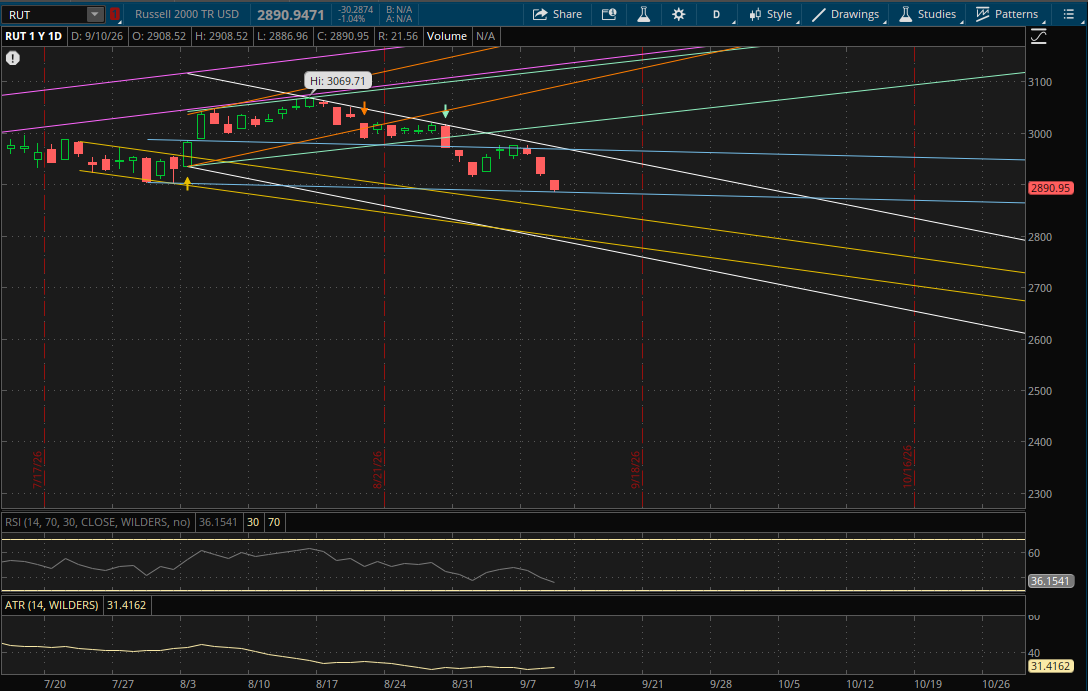
The Russell 2000 traded within its primary downtrend again so its daily ranges remain the same for now. On a bounce back tomorrow, the only resistance level to watch will be at about 2,970 from its prior downtrend (blue) and primary downtrend (white).
If the sell-off continues, the first support to watch will again be from its prior downtrend (blue) at 2,885-2,886 which it did test and hold today. If it breaks below it tomorrow, or potentially gaps below it, then the next support will be at about 2,852 from its next downtrend (yellow). If that doesn't hold, this same trend (yellow - bottom of the range) would be support again at 2,795-2,800 and finally its primary downtrend (white) would be the last daily support at 2,785-2,790.