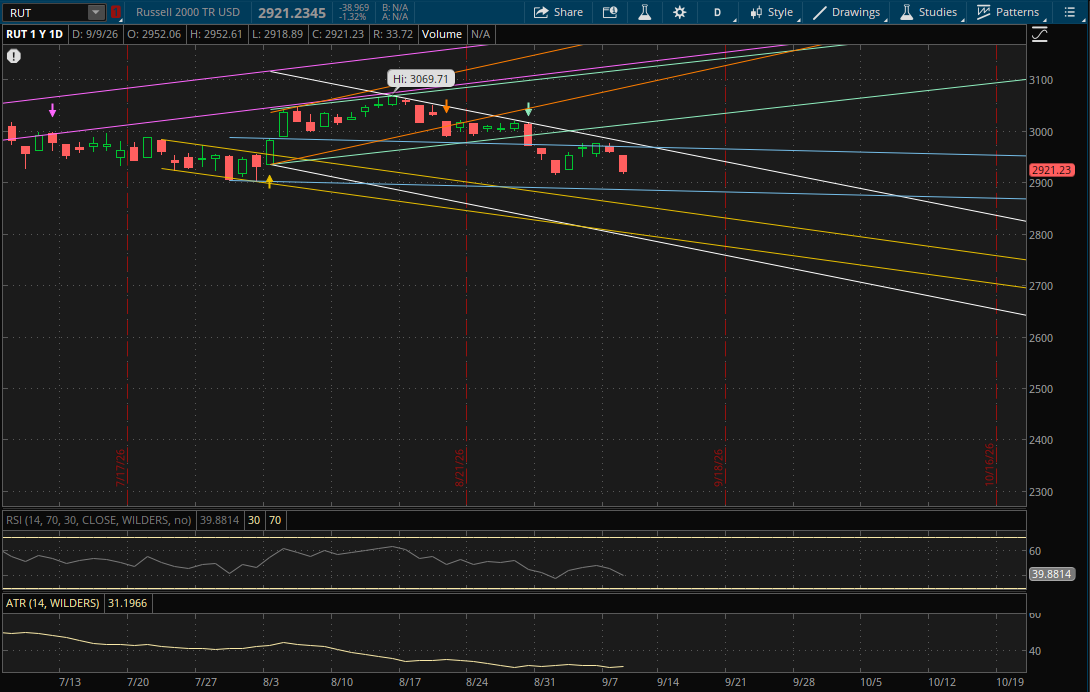
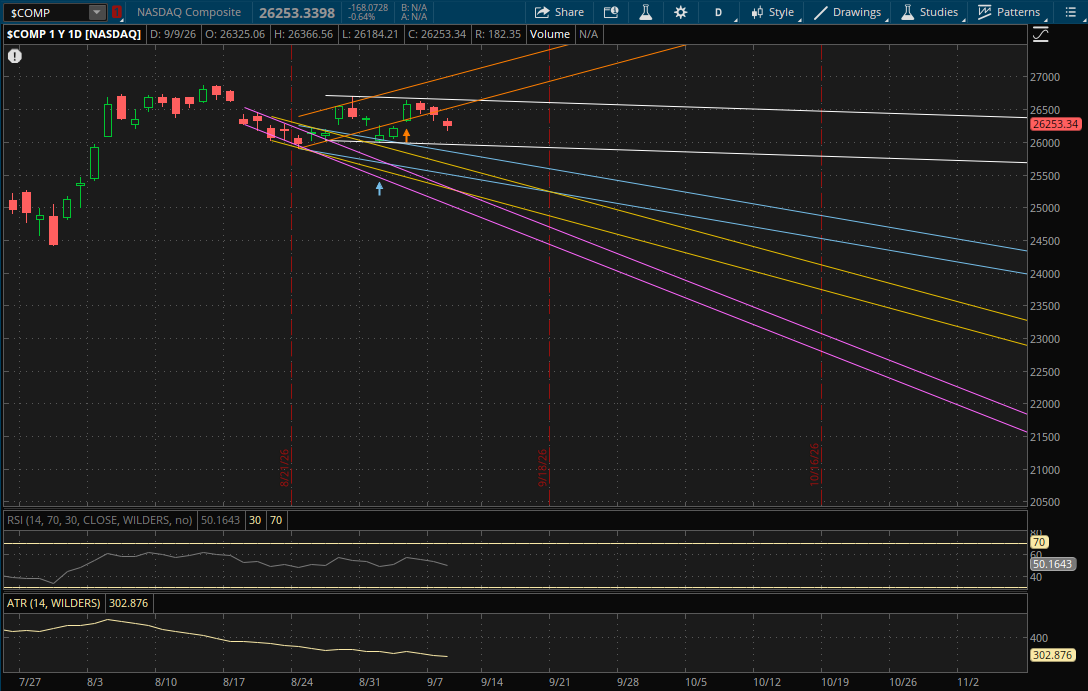
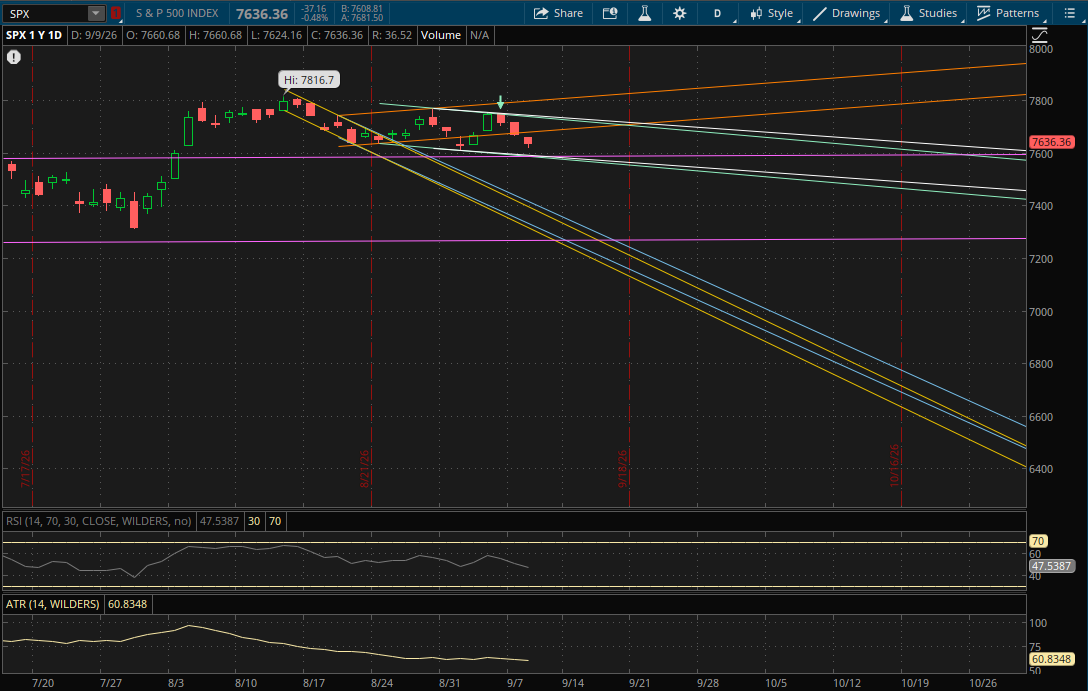
The Treasury announced that their buyback operation for tomorrow would be $6B which is triple the amount of the normal $2B size. However, the street was expecting it to be between $6B-$10B and this came in on the lower end which the market didn't seem too thrilled about as yields spiked on the announcement and markets sold off. The 10 year treasury jumped to a high of 4.849%, its highest since November of 2023. Oil also jumped nearly 4% which contributed to the market pullback as inflation fears continue. Small caps were the laggard today as the rate sensitive Russell 2000 fell 1.32%. The Nasdaq lost 0.64%, but semis once again held up well with both SMH and SOXX finishing slightly positive on the session. Meanwhile the S&P fell 0.48% and the VIX settled up 4.7% at $16.46.
Tomorrow morning we will get the first piece of inflation data for the week with PPI at 8:30 AM ET. Then on Friday morning we will get the CPI print, which will be the bigger catalyst of the two. However both will be key for the Fed as they decide what to do with interest rates next week.
The Nasdaq remained within its primary downtrend again today so it doesn't start any new daily trends for tomorrow. On a bounce back tomorrow its prior uptrend (orange) will be the first resistance level to watch again around 26,575. If it breaks through, the last daily resistance will be at about 26,650.
On a continuation of the pullback, its primary weekly uptrend (see the weekly update) will still be the first key support to watch around 26,100. If it doesn't hold, its primary daily downtrend (white) will be the next support at 25,950-25,960. If that breaks as well, its prior downtrend (blue) will likely be the last daily support that comes into play around 25,825.
The S&P also remained in its primary downtrend today so it doesn't start any new daily ranges for tomorrow either. On a bounce back, the first resistance to watch will be from its prior uptrend (orange) at about 7,685. If that breaks, the last 2 daily resistances will be at 7,735-7,740 from its failed breakout (green) last week and its primary downtrend (white).
If we get another pullback, the next big support area to watch will be at 7,585-7,590 from its prior sideways range (purple), primary downtrend (white), and next downtrend (green). This will be a big support area where all 3 of those trends intersect.
The Russell 2000 once again traded within its big primary downtrend, so it also doesn't start any new daily ranges here. On a bounce back, its prior downtrend (blue) will continue to be the first resistance level to watch at about 2,970. If it breaks through it, the last daily resistance will be from its primary downtrend (white) at 2,975.
The Russell did break through its primary weekly uptrend support this afternoon at about 2,920, just by a little bit, hitting a low of 2,918.89. But, it will start a new weekly trend at the end of the week. We just have to wait to see how it closes to determine the direction of that new trend. On a daily time frame, now that 2,920 has been broken, the next support to watch will be at about 2,885 from its prior downtrend (blue) on a continuation of the sell-off. The last daily support to watch would be from its next downtrend (yellow) at about 2,855.