Tensions escalated again between the U.S. and Iran today, sending oil higher by about 3% and reaching its highest level in 3 months as it nears $100/barrel again. This also caused treasury yields to rise with the 10 year yield climbing back above 4.8%. The Nasdaq was the outperformer today as semis held up well, but the Nasdaq still posted a loss of 0.32%. The S&P also lost 0.58% while the Russell 2000 fell 0.52%. With today's pullback, the VIX settled up 2.75% at $15.72. Tomorrow morning at 11:00 AM ET we will get the Treasury Buyback Announcement, which will be the first one since Treasury Secretary Scott Bessent said they would be increasing their buyback operation. We will find out tomorrow exactly how aggressive Bessent is going to be with it.
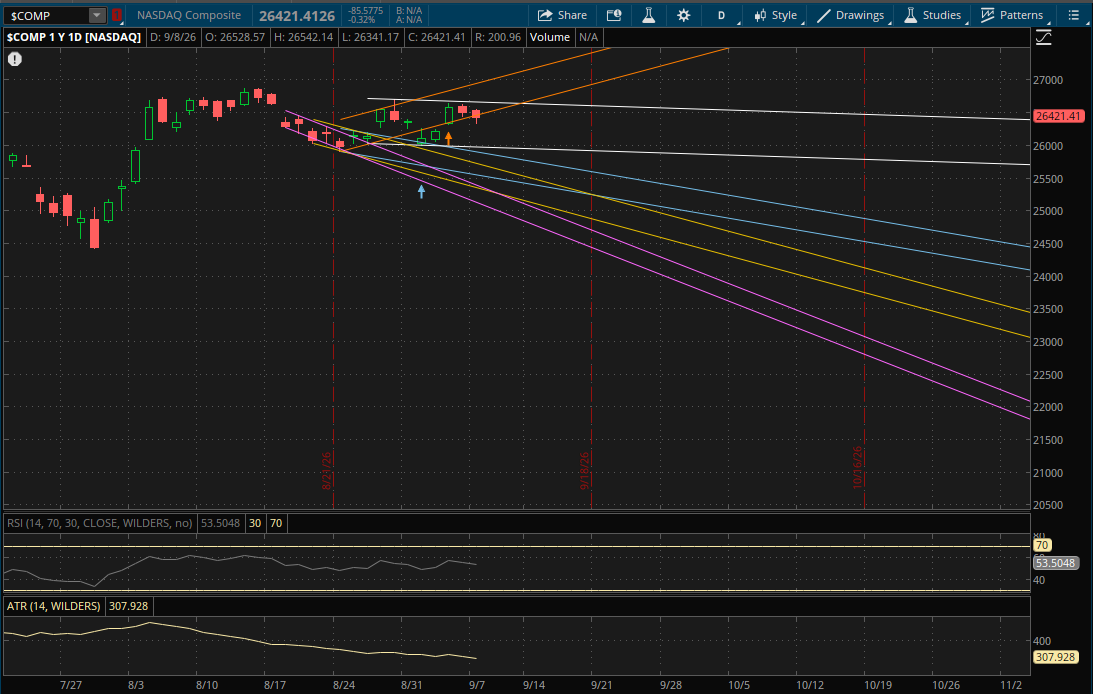
From a technical perspective, not a lot changes. The Nasdaq didn't break through its primary trend and doesn't start any new ones. It did break and close below its prior uptrend (orange), but hasn't invalidated it yet. So that prior uptrend will be the first resistance to watch on a bounce back tomorrow around 26,525. If it breaks through it, the last daily resistance will be from its primary downtrend (white) around 26,650.
If the pullback continues, the first support to watch will be from its prior weekly downtrend (orange - see the weekly update) around 26,340-26,350 which is what it bounced off of today. If it breaks through it tomorrow, then the next daily support will be from its primary downtrend (white) at 25,960-25,970.
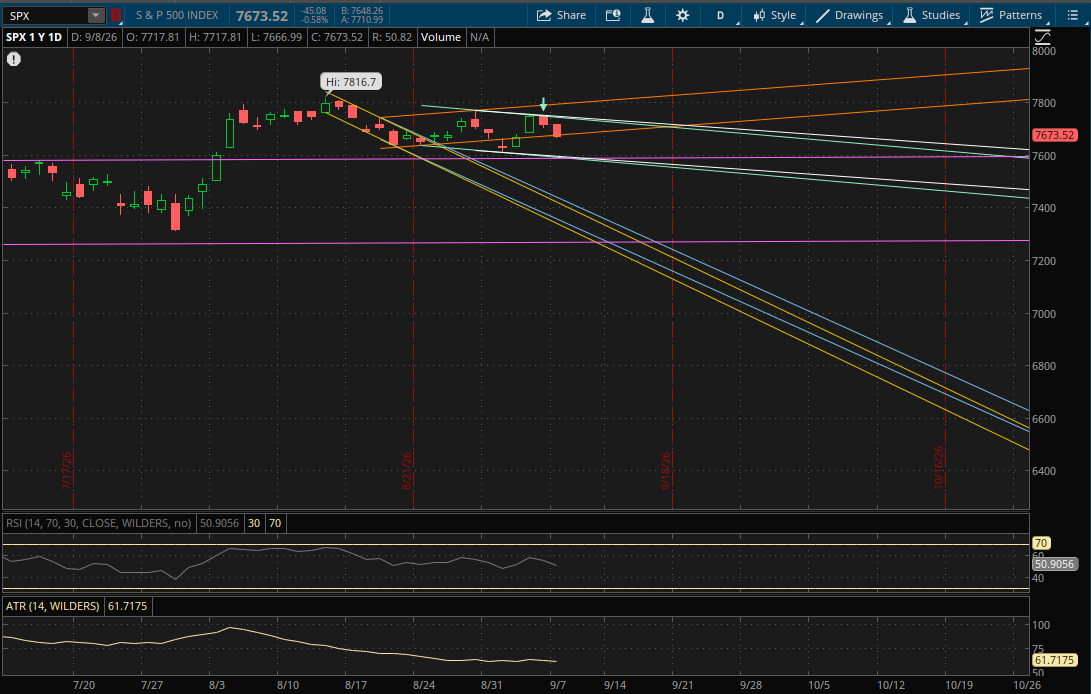
The S&P also remained within its primary downtrend so it doesn't start any new trends for tomorrow either. The first level to watch for tomorrow will be from its prior uptrend (orange) which it broke and closed below today. That will now be the first resistance level on a bounce at about 7,682. If it can gap back above it in the morning, then it will act as support again. From there, its next resistance will be at last week's failed breakout (green) at about 7,740 with more just above that from its primary downtrend (white) at 7,745 which will be the last daily resistance to watch.
On a continuation of the pullback, the next daily supports to watch will be at 7,788-7,793 from its primary downtrend (white), prior sideways range (purple) and next downtrend (green) where all 3 trends meet. This will be a big support area to watch from all 3 of those trends if it's tested tomorrow.
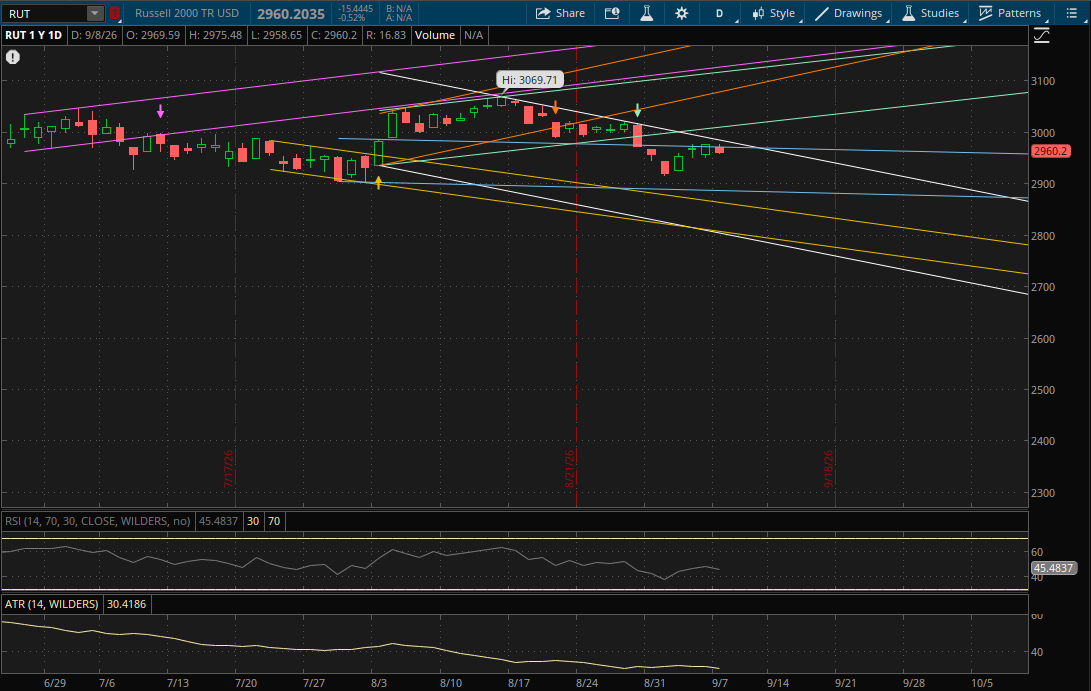
The Russell 2000 failed to get the gap up it needed to confirm the failed weekly breakdown that I wrote about over the weekend (see the weekly update). I stayed out of it for this reason as it was no longer an optimal bullish setup. On a daily time frame, it didn't break through its primary trend today, so similar to the S&P and Nasdaq - it doesn't start any new daily trends for tomorrow.
The first resistance will continue to be from its prior downtrend (blue) at about 2,970. If it can break through, its primary downtrend (white) will be the last daily resistance at about 2,980. On a sell-off, the only support that likely comes into play tomorrow would be from its prior downtrend again (blue - bottom of the range) at 2,885-2,887.