The Russell 2000 was the big loser in September as it fell 5.4% and closed at the lows of the month. This was it's biggest monthly decline since the 2025 tariff war sell-off. The S&P also closed the month lower by about 0.50% while the Nasdaq posted a gain of 1.8% and was the only index to hit new all time highs in September. On Friday we will get the September jobs report and after that the next big economic catalyst will be CPI on October 14th before the next Fed rate decision on October 28th.
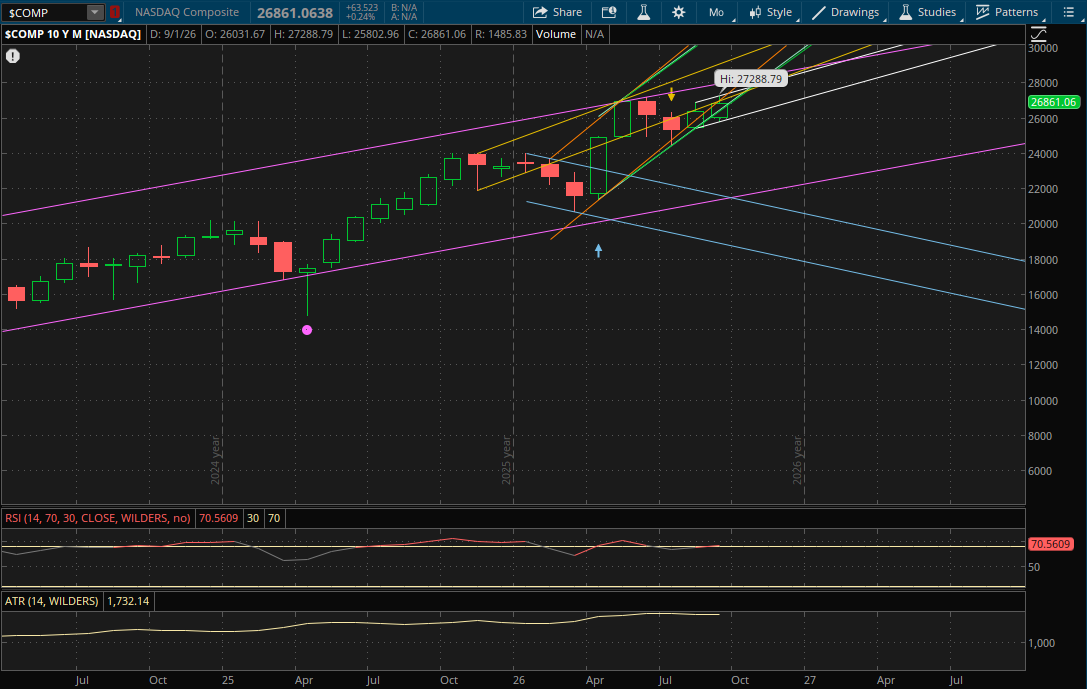
Since this was the end of the month and quarter, I'll be looking at both monthly and quarterly charts. For the month, the Nasdaq had a failed breakdown as it opened below its previous primary uptrend in September but broke through it and closed above it. This starts a new primary monthly uptrend (white) for it heading into October.
The problem now is that all of its prior monthly uptrends will act as resistance as it will open below all of them tomorrow. The first big resistance level to watch on a monthly time frame in October will be at 27,400-27,500 from its first 3 uptrends (green, teal, and yellow) where the 3 trends intersect. If it can break through all of them, its new primary uptrend (white) will be resistance at 26,750-26,800. After that, the last monthly resistances will come from its next 2 uptrends (orange and purple) at 28,150-28,200.
On another pullback in markets, the only support to watch will be from the bottom of its new primary uptrend (white) around 26,200. That's only about 2.5% away from today's close of 26,861. If it were to break down through it, it would start a new primary trend heading into November, but we would have to wait and see how it closes to determine the direction of that new trend.
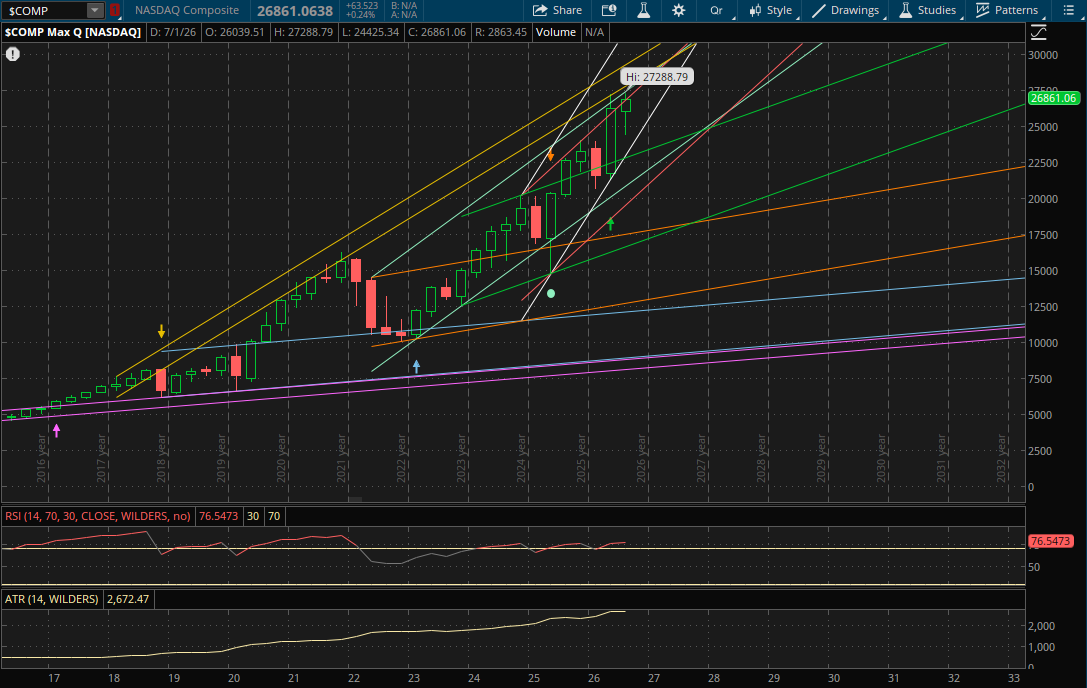
On a quarterly time frame, nothing changes as it remained within its primary uptrend this quarter. It did break through its first quarterly resistance this quarter (red), but didn't invalidate it and closed just below it, so it will continue to be the first resistance to watch next quarter around 27,850. If it breaks through it again, the next quarterly resistance will be at 28,200-28,250 from its next uptrend (teal) followed by the 28,450-28,500 level (yellow).
If we get a sell-off into year end, the first quarterly support to watch will be from its primary uptrend (white) at 24,700-24,750. If that doesn't hold, its next uptrend (green) would be support at 23,200-23,225 which would probably be the last quarterly support that potentially comes into play as it is over 13% away.
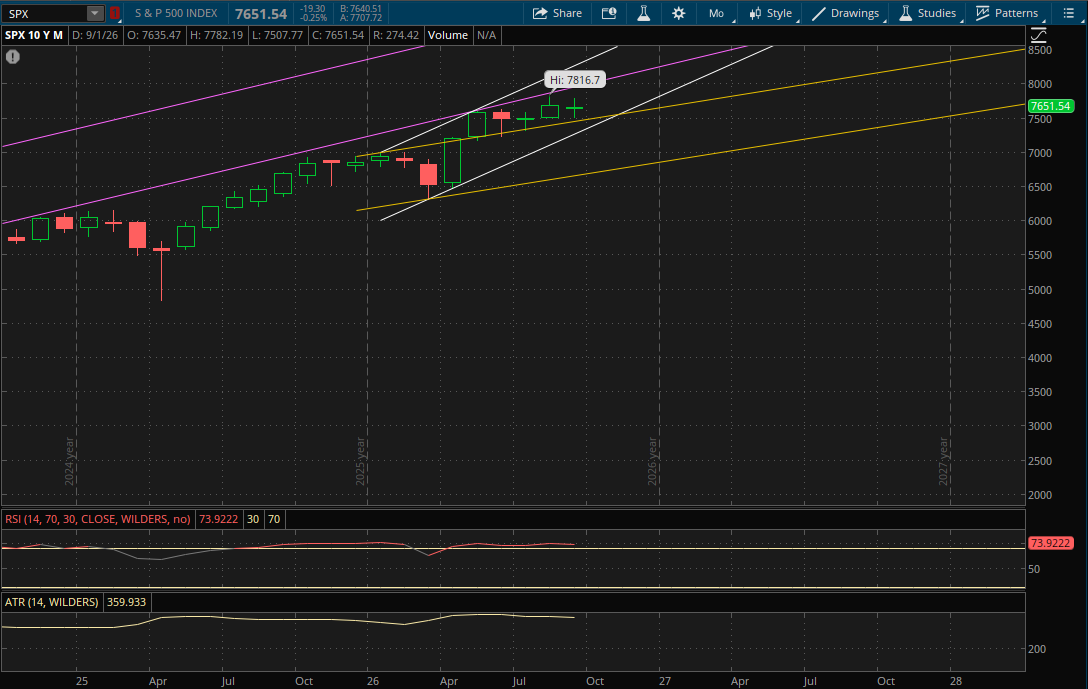
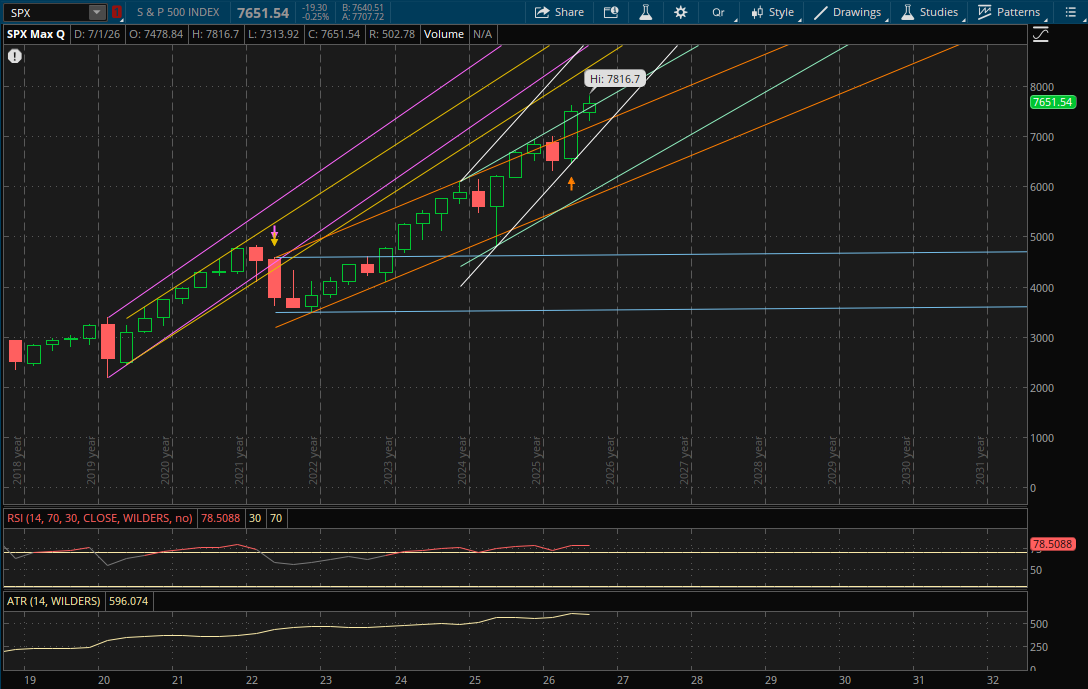
The S&P on a monthly time frame remained in its primary uptrend so it doesn't start any new monthly ranges heading into October. The first resistance to watch on a rally attempt will be from its prior long term uptrend (purple) at 8,040-8,050 which would be new all time highs for it. If it breaks through that, the last monthly resistance to watch will be at 8,420-8,430 from its primary uptrend (white).
On a pullback, the first support to watch will be from its previous uptrend (yellow) at 7,510-7,520. It has held this support over the last 5 months and continues to trade along it. If it breaks through it this time, the bottom of its primary uptrend (white) will be the next support to watch at 7,420-7,430. The only other monthly support after that would be from the bottom of its yellow downtrend around 6,725. However, this is about 12% away so it's extremely unlikely that it reaches this level.
On a quarterly time frame, the first resistance level to watch will be right around 7,800 from its first uptrend (teal). If it breaks through it, the next resistance is far at 8,640-8,650 (yellow) which would likely be the last quarterly resistance that comes into play as the next one (purple) is around 9,100.
On a pullback, the first support to watch will be at about 7,350 (orange) with more just under that right around 7,300 from its primary uptrend (white). So this 7,300-7,350 area would be big support where these 2 trends meet. This would only be a 4-5% pullback from current levels, so on a quarterly basis it's not much. If it breaks through the primary uptrend, the next support is very far away around 6,100 (teal). This is extremely unlikely to come into play by year end. Instead, it will just start a new trend heading into 2027 but we would need to see how the year finishes first to determine the direction of that new trend.
The Russell 2000 gapped and closed below last month's primary uptrend, but for now it still starts a new primary uptrend. The problem is that it closed essentially at the low of the month and there is risk of it opening below this new primary uptrend (white) tomorrow which will be at 2,810-2,815 for October. That is above today's close of 2,796. So the Russell would need to gap up tomorrow to start the month in order to open above this primary uptrend. If it can gap above 2,810-2,815 tomorrow then that primary uptrend will act as support and the next monthly resistance will be at 2,850-2,855 from its previous uptrend (teal). If it can break through that level, the last monthly resistance that potentially comes into play would be from its next uptrend (orange) at 2,970-2,975 near the September high.
If the Russell 2000 fails to gap up above its primary uptrend (white) tomorrow at 2,810-2,815 then this level will be resistance on a rally attempt. The next support to watch on a continuation of the sell-off next month would then be from the bottom of its next uptrend (orange) at 2,580-2,590 which would be another 7-8% away and would likely be the only monthly support that comes into play for October.
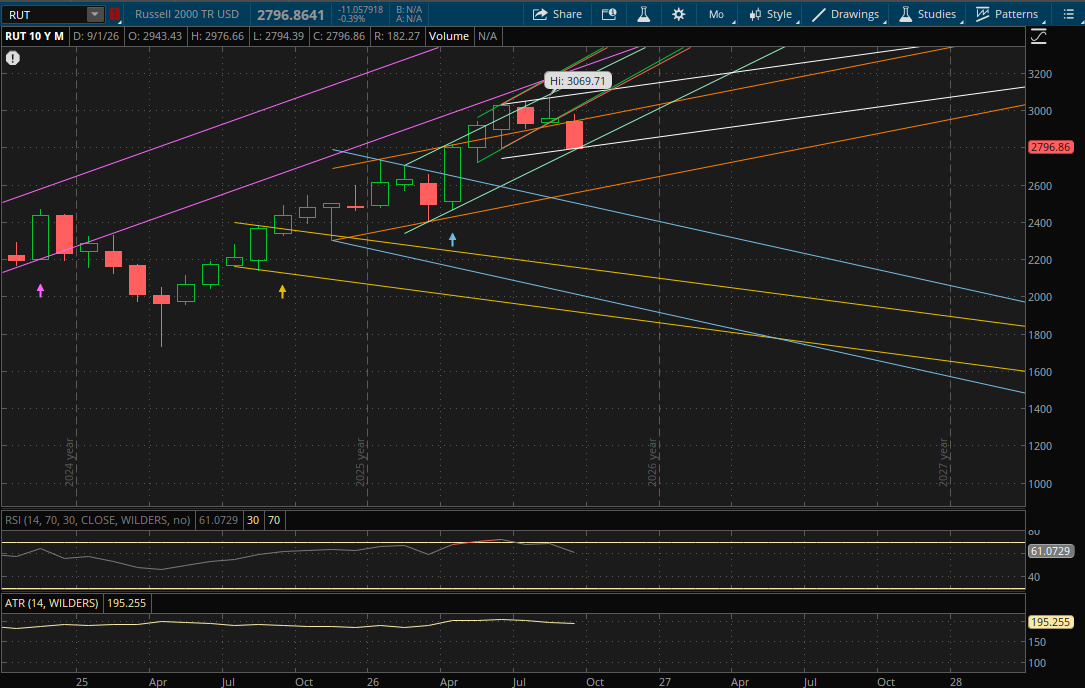
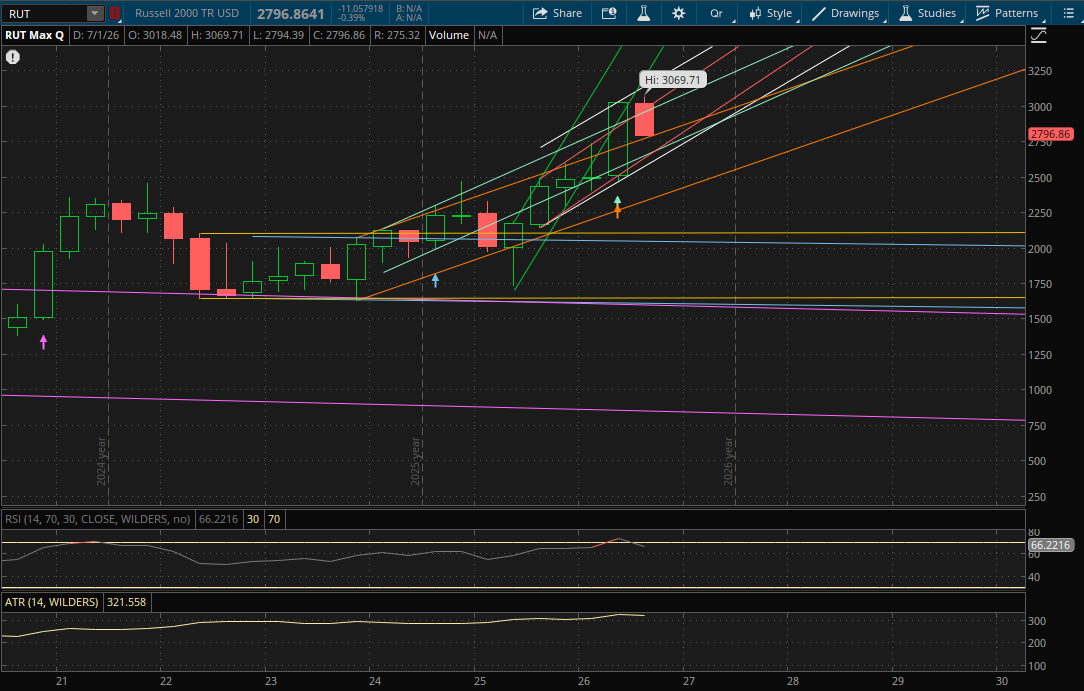
On a quarterly time frame there's a lot going on for the Russell as there are several trends that remain active for now. First we'll look at resistances. On a rally into end of year, the first resistance to watch will be at 2,835-2,840 (orange) which is above today's close of 2,796. If the Russell can gap up above that 2,835-2,840 level then it would become support. After that, its next uptrend (teal) will be resistance at 3,040-3,050. If it can break through it, its next uptrend (red) would be resistance just above 3,100 which would be new all time highs for it. The last quarterly resistance that potentially comes into play with a rally into year end would be from its primary uptrend (white) around 3,250.
If the Russell does not get a gap above its first key level (orange) at 2,835-2,840 tomorrow then this area will be the first quarterly resistance to watch. On a continuation of the pullback in small caps, the next support would then be from the bottom of its next uptrend (red) at 2,765. If that doesn't hold, it will have more support just below that at about 2,740 from the bottom of its next trend (teal). After that, the bottom of its primary range (white) would be support around 2,690 which would be another 3-4% pullback from here. If this doesn't hold, the next quarterly support would be from the bottom of its orange uptrend around 2,400. It would also start a new trend heading into 2027 if its primary uptrend were to break and we would need to see how it finishes the year to determine the direction of that new trend.