The 10 year treasury yield broke above 5.3% this morning, hitting its highest level since 2002. This sent stocks lower again in the morning, but yields pulled back and the 10 year finished down for the day around 5.24%. This was especially helpful to small caps as the Russell 2000 went from lagging to leading on the day as it closed up 0.35% while the Nasdaq and S&P gained 0.04% and 0.19%, respectively. The VIX was up as much as 7.6% at its highs this morning, but it finished the day flat with the rally back in markets. Tomorrow morning we will get the September jobs report which will likely shift odds for the October Fed rate decision.
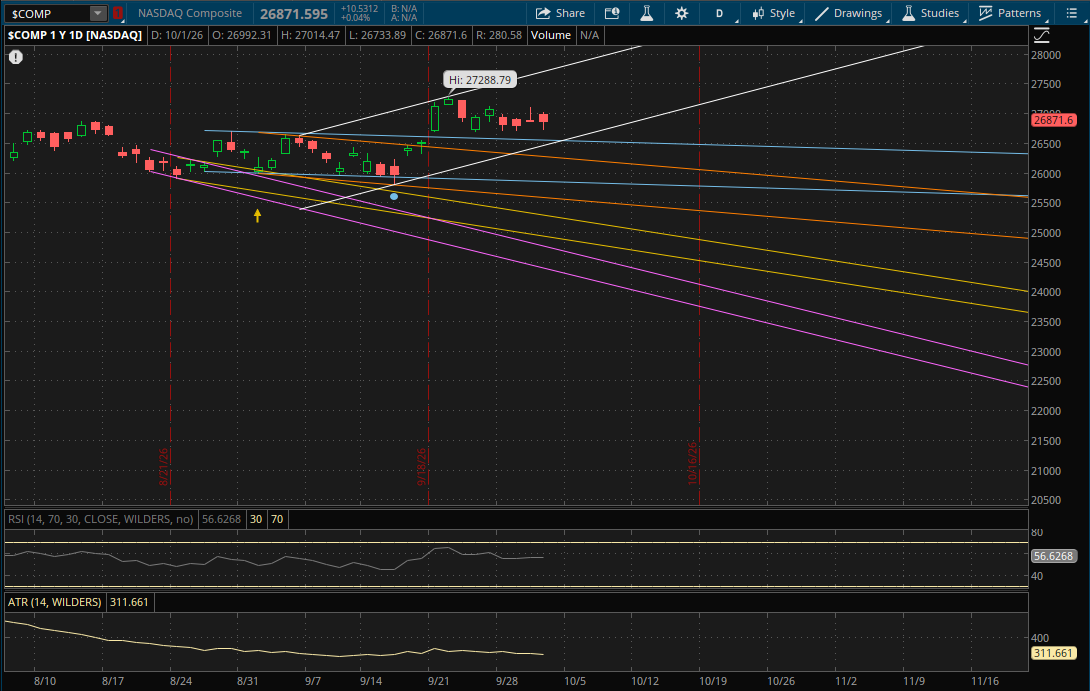
For the Nasdaq, the daily chart remains the same as it continues to chop in its big primary daily uptrend (white). This will continue to be the only resistance level to watch on a rally attempt, however it is very far away around 27,750-27,775, so even if we were to get a big rally tomorrow it's very unlikely that the top of this range would be tested.
On another pullback, the first support to watch will once again be from its prior downtrend (blue) around 26,550 with more just below that from the bottom of its primary uptrend (white) around 26,525. So this 26,525-26,550 area will be a big level to watch where those 2 trends meet.
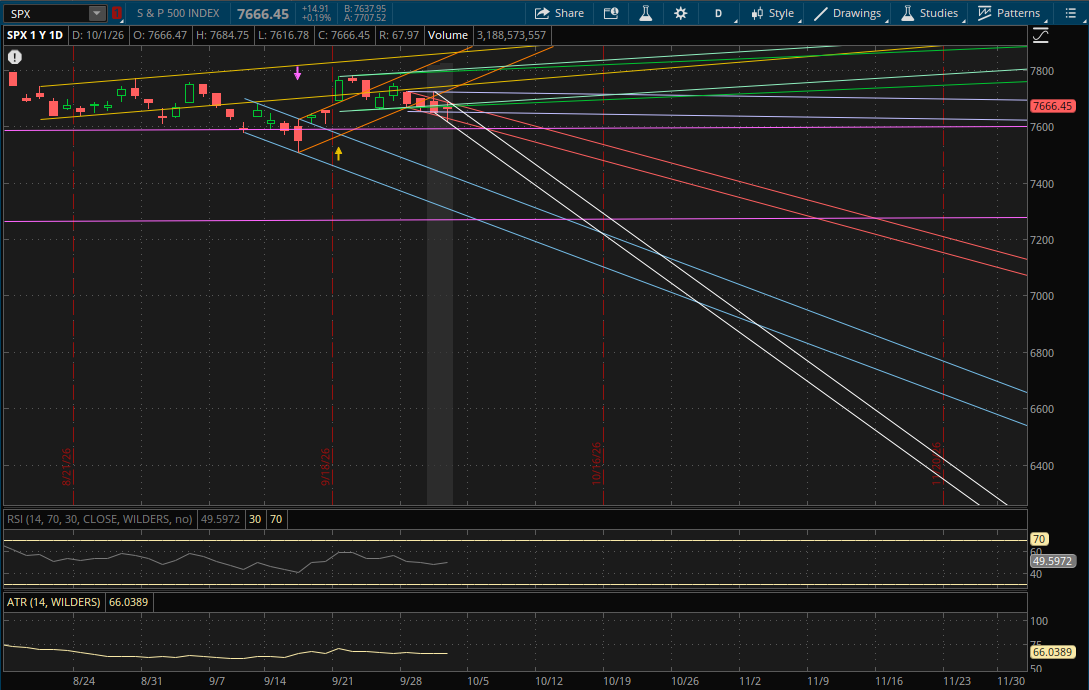
The S&P broke well below yesterday's primary downtrend that was started, but it rallied back to close above it which gives it a failed breakdown. This was a strong failed breakdown and is a bullish short term signal. However, it needs to avoid a gap down below the retest of the failed breakdown tomorrow which will be around 7,650 (light purple). The S&P closed at 7,666 today, but because there is a big catalyst tomorrow morning with the September jobs data, it's essentially a toss up for how it opens.
As long as the S&P doesn't gap below 7,650 tomorrow, that area will act as support. Its new primary downtrend (white) will also be just under today's close around 7,654-7,655. So if it opens above it, this will also act as support. On a rally attempt, the next resistances to watch will be 7,672 (red), 7,675 (green), and 7,680 (teal). It's also possible that we see a gap above all 3 of these levels as they're very close. If that happens, they become supports as well. After that, the next resistance to watch will be from the top of today's failed breakdown range (light purple) at 7,720-7,722. If it can break through it, or potentially even gap above it, the last daily resistance that likely comes into play will be at about 7,748 from its next 2 trends (orange and yellow) where they intersect.
If we sell-off on the jobs data tomorrow, the first support to watch will be from its new primary downtrend (white) at 7,654-7,655 and then the retest of today's failed breakdown (light purple) at 7,650 assuming it still opens above them. If we get a gap below those levels, they both become resistance. After that, the next support to watch will be at 7,615 from the bottom of its next downtrend (red). If this breaks, its prior sideways range (purple) would be next at about 7,590. Its last daily support would be from the bottom of its primary downtrend (white) at 7,580-7,581.
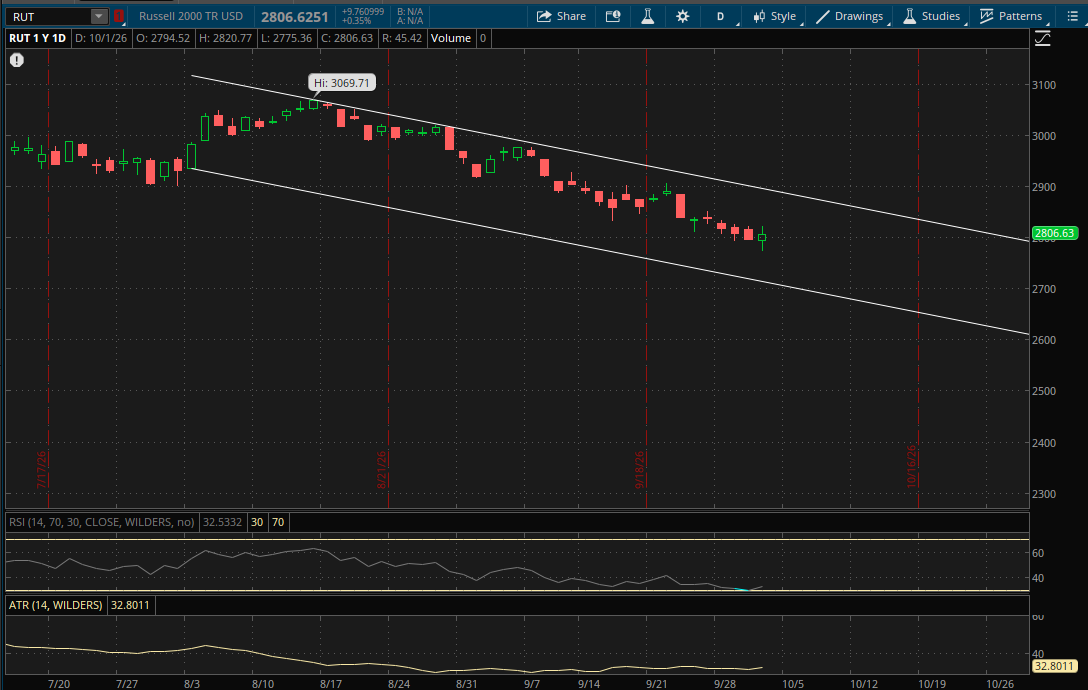
The Russell 2000 continues to trade within its big primary downtrend near the middle of the range and will likely remain in it as both ends of the range are pretty far. Resistance from this downtrend will be at 2,890 tomorrow while support will be at about 2,710 which are each about 3% away from today's close. So it's unlikely either side of the range gets tested again.