Thursday's bounce back in markets didn't last as the AI fueled sell-off continued yesterday with SOXX falling over 4%. This led to underperformance in tech again with the Nasdaq closing down 2.15% while the Nasdaq 100 lost 2.50%. There was no rotation into small caps either this time as the Russell 2000 closed down 1.66% while the S&P lost 1.09%. The VIX spiked as much as 35.50% during yesterday's sell-off as it hit a high of $22.31 before pulling back to settle at $19.99 for a gain of 21.4%. This was the highest level for the VIX since June 11th. Oil also contributed to the sell-off as it jumped another 2.60% and is once again approaching $100/barrel. However, yields finished near lows with the 10 year essentially closing flat on the day.
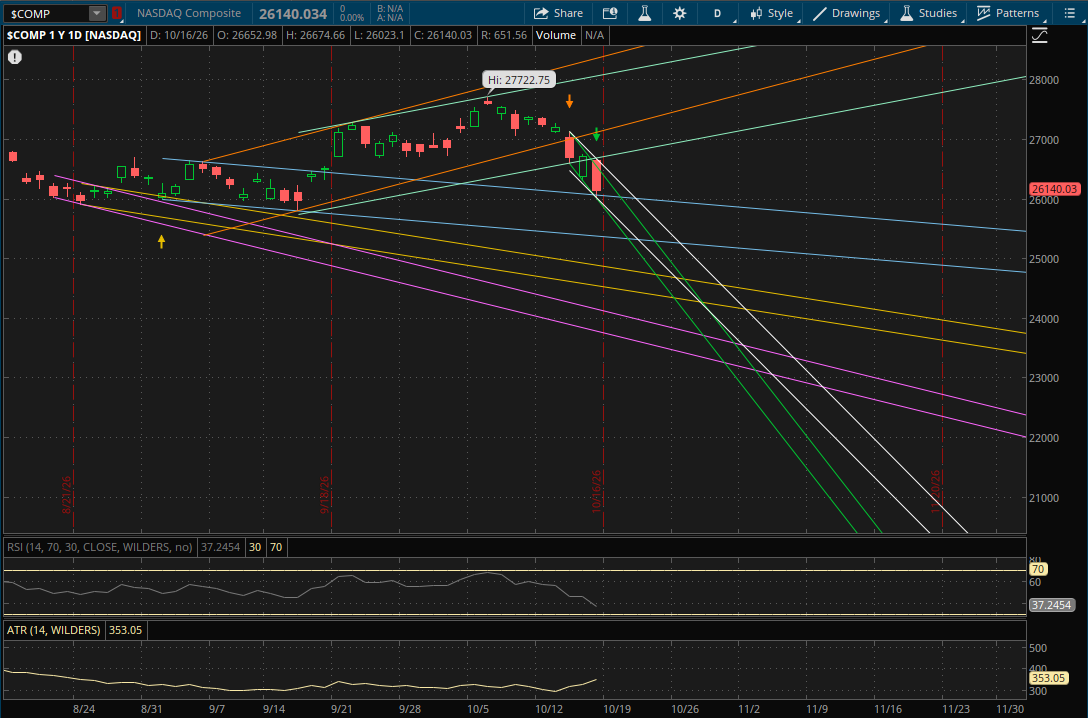
The Nasdaq did open above its previous primary downtrend that was started on Thursday, however it did not open above its prior uptrend around 26,690 which then became resistance. It failed to break through it, hitting a high of 26,674.66 before selling off again. The Nasdaq also failed to close above its previous primary downtrend, giving it a failed breakout which starts a new primary downtrend (white) heading into Monday.
The first resistance level to watch on a rally attempt for Monday will be at 26,240-26,250 (green) which would be a retest of yesterday's failed breakout. This level is about 0.40% away from Friday's close at 26,140, so there is potential for a gap above it. If that were to happen, the 26,240-26,250 area would become support. If it does gap or break above it, the next resistance will be from its new primary downtrend (white) at 26,440-26,450. If it breaks through this primary downtrend as well, the last resistance to watch would again be from its previous uptrend (teal) at 26,725-26,750.
On a continuation of the pullback, the next support to watch will be from its prior downtrend (blue) at about 26,050. It did break through this downtrend yesterday, but it hasn't invalidated it yet. If it breaks through it again, the bottom of its new primary downtrend (white) would be the next support at 25,775-25,800 with more just below it at 25,700-25,725 from the bottom of yesterday's failed breakout (green). If this fails to hold, the last daily support that likely comes into play on another big sell-off would be from the bottom of its next downtrend (blue) at 25,350-25,375 which is about 3% away.
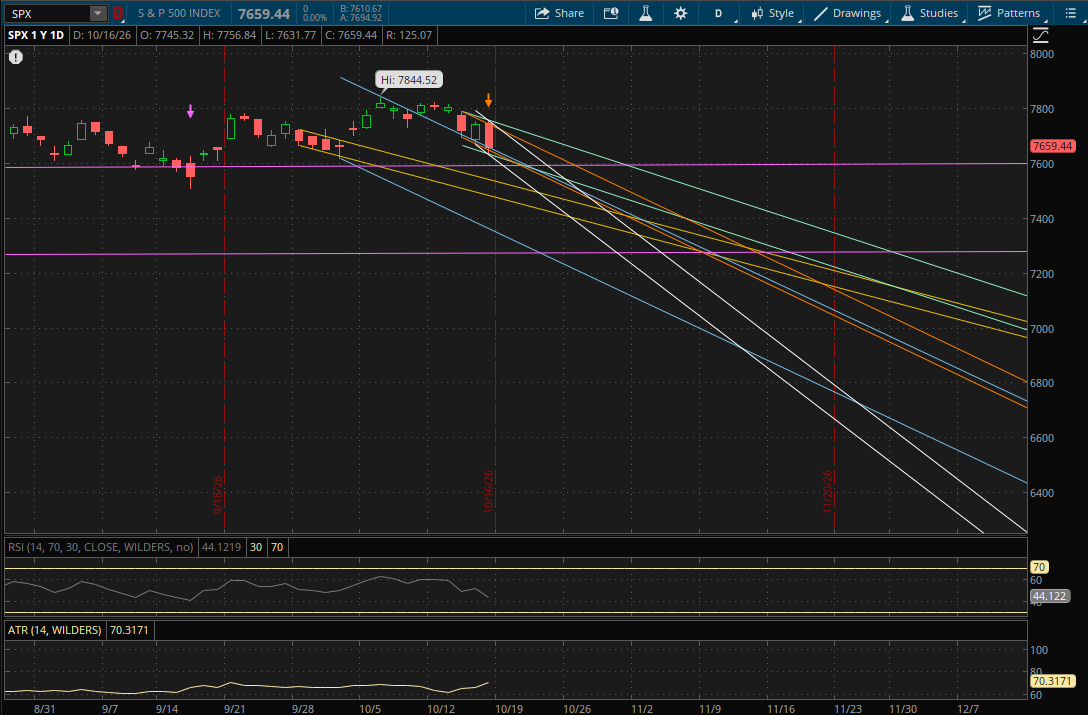
The S&P also had a failed breakout yesterday as it opened above its primary downtrend and failed to close above it. This starts a new primary downtrend (white) for it going into Monday's session. If there's a rally back, the first resistance to watch would be at 7,715-7,720 which would be a retest of the failed breakout (orange) and resistance from its new primary downtrend (white). So this would be a big resistance level where these 2 trends intersect. If it does manage to break through them, the last daily resistance to watch would be from its next downtrend (green) at about 7,740.
On a continuation of the sell-off, the first support to watch will be at 7,633-7,635 (blue). After that it will have support at 7,622-7,623 (orange) and more just below that at about 7,615 from the bottom of its next downtrend (green). If neither of those hold, the last daily support to watch will be at 7,590-7,595 from both its prior sideways range (purple) and the bottom of its new primary downtrend (white). So this will also be a big support level to watch where those 2 trends intersect.
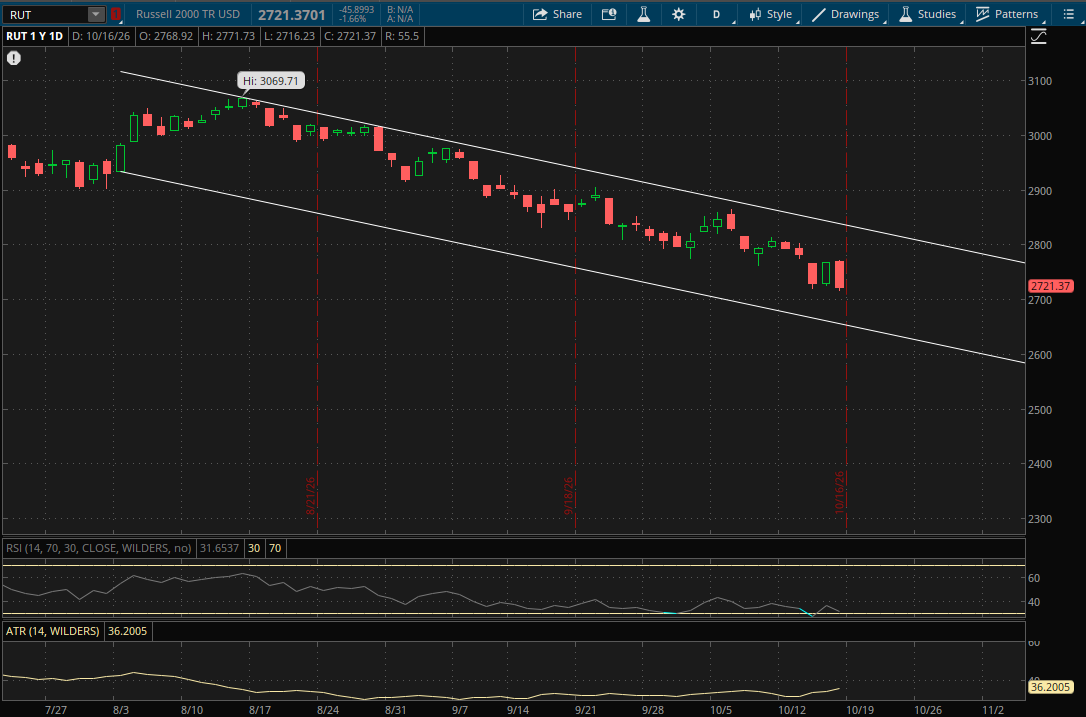
The Russell 2000 continues to trade in its big primary daily downtrend which remains as the only valid daily range for it, so once again nothing changes for it on a daily time frame. For Monday, on a rally back, the only resistance to watch will be from the top of this range at 2,830-2,835 while the only support to watch will be from the bottom of the range at 2,650-2,655.