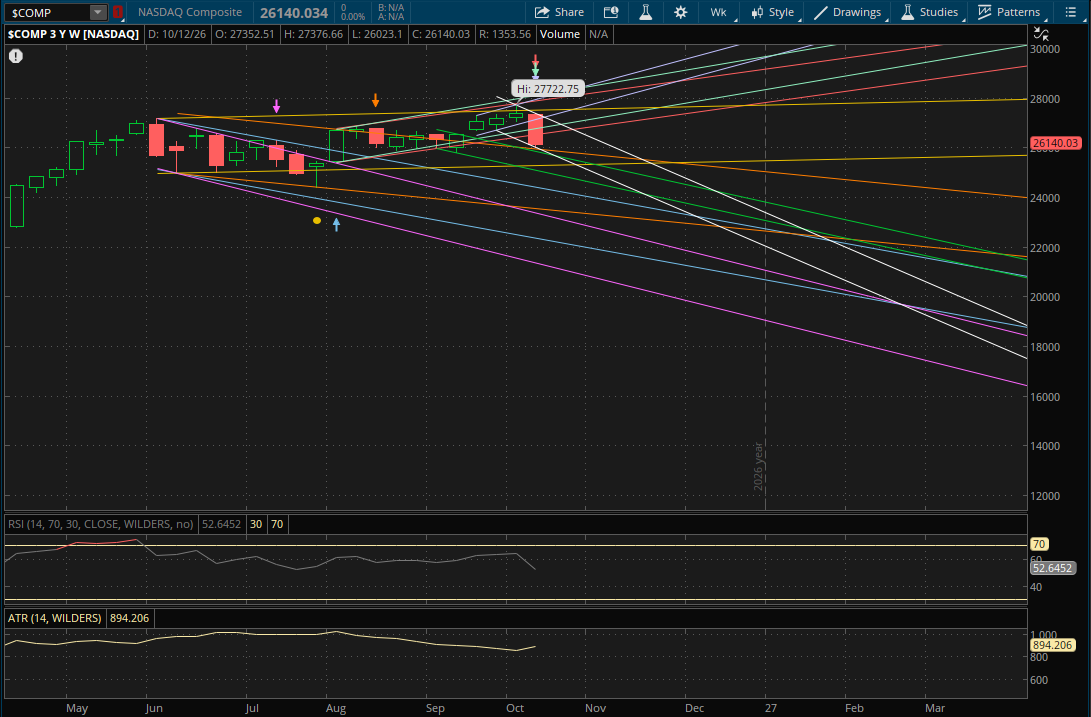
After hitting a new all time high last week, the Nasdaq fell 4.5% this week and posted its biggest weekly loss since June. The big loss was fueled by selling in AI/semis as the SOXX fell nearly 12% for the week. But the selling spilled over into the rest of tech as well as the MAGS fell 2% on Friday while CIBR (Cybersecurity ETF) lost nearly 5%. The S&P lost 1.9% for the week while the Russell 2000 lost another 3% despite a pullback in yields. The Russell 2000 has now fallen over 11% from its all time high in August. With the big sell-off late in the week, the VIX finally spiked as much as 35% on Friday before it pulled back to settle at $19.99 for a weekly gain of 34%.
Next week the big focus will likely be on tech earnings after the big sell-off last week. Tesla (TSLA) and Meta (META) will be the biggest names, both reporting on Wednesday (10/21) after the close, but there will be some semis reporting too which will be key to watch after the big rout in the AI trade. Lam Research (LRCX) and Texas Instruments (TXN) will be the 2 big semi/AI related names to watch for on Wednesday after the close as well.
Looking at the technical setup, the Nasdaq had a big weekly breakdown this week as it broke below 3 weekly supports, including its primary trend, which now starts a new primary downtrend (white) for it heading into next week. First we'll look at resistances. On a rally back next week, the first resistance will be at 26,650-26,675 (red) which is about 2% away. If it breaks through it, the next resistance will be at about 26,925 (teal). The last weekly resistance that potentially comes into play would be from its new primary downtrend (white) at 27,025-27,050 which is about 3.5% away.
On a continuation of this sell-off, the first support to watch will be at 25,850-25,875 (orange). After that, the 25,650-25,675 level will be a big support to watch from the bottom of its new primary downtrend (white) and its next downtrend (green) where the 2 trends intersect. This is almost 2% away from Friday's close. If this level doesn't hold, the last support that likely comes into play would be from its prior uptrend (yellow) at 25,300-25,325.
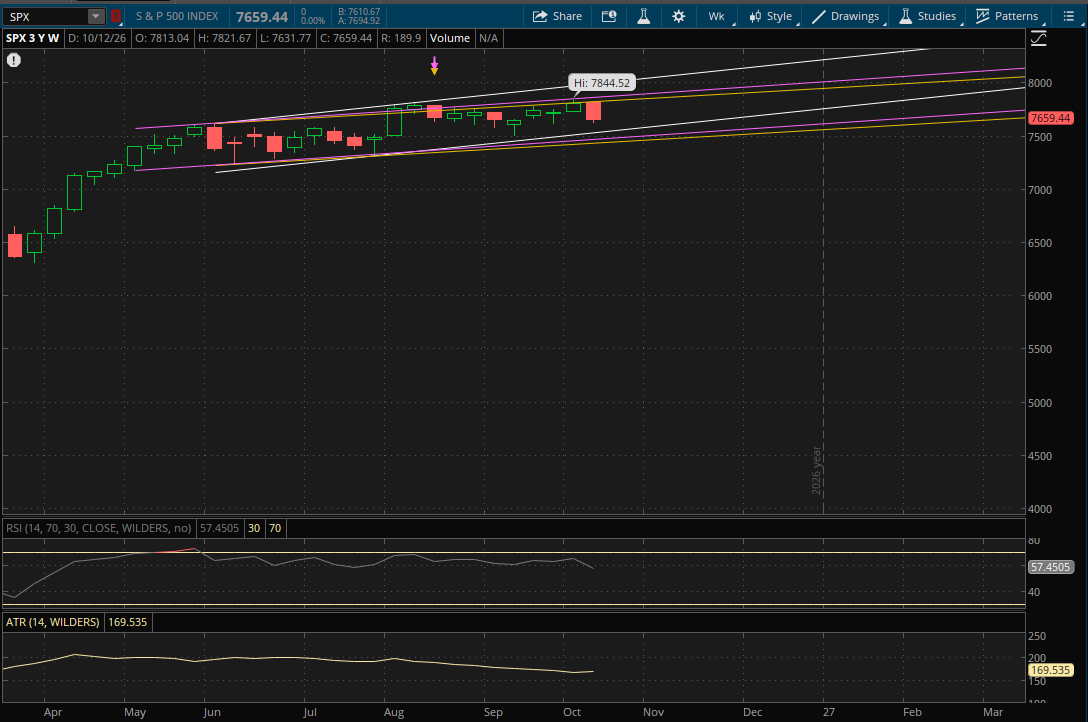
The S&P got rejected at the first weekly resistance (yellow) that I mentioned in last week's update to watch out for. It has been trading in the same weekly trends that it has been in since May, so it doesn't start any new trends again. For next week on a rally attempt, the first resistance to watch again will be from that same prior uptrend (yellow) at about 7,840 which is about 2.4% away. If it breaks through it, the last resistance that potentially comes into play would be from its next uptrend (purple) at about 7,875. Its primary uptrend (white) will be much further away - just above 8,000, so it's very unlikely that it comes into play.
On a continuation of the sell-off, the bottom of its primary uptrend (white) will be the first support to watch at about 7,550 which is about 1.5% away. If it breaks through it, the next weekly support to watch will be at 7,480-7,485 (purple) with the last support just below that at 7,445-7,450 (yellow).
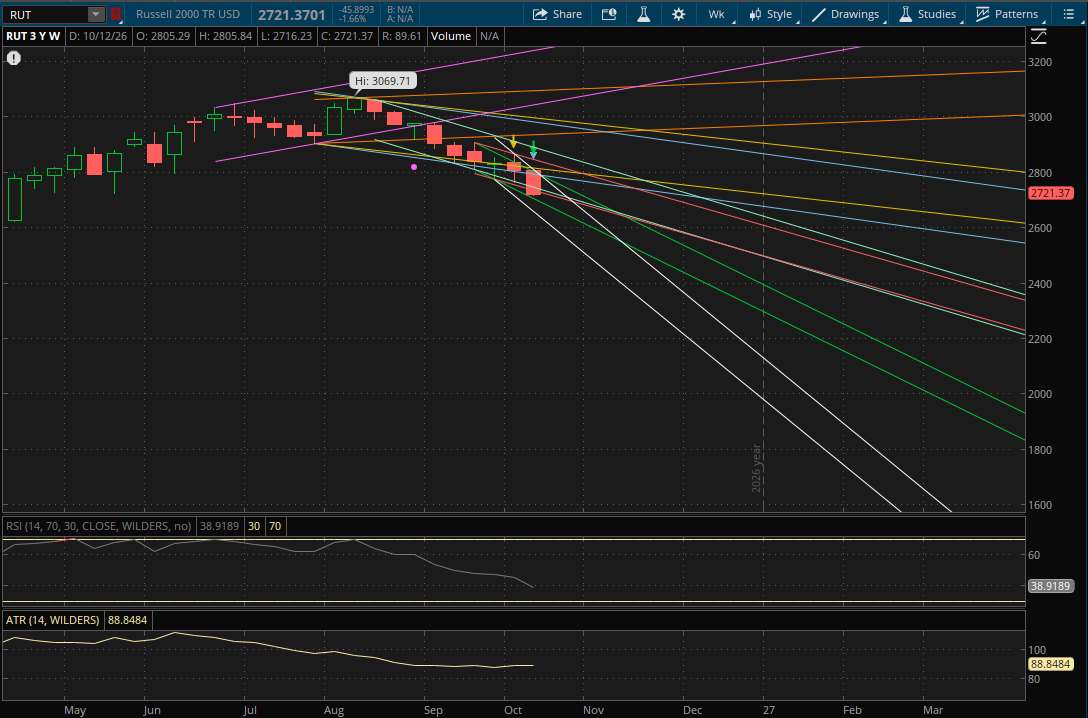
The Russell 2000 broke and closed below last week's primary downtrend which starts another new primary downtrend (white) for it going into next week. For next week the first 2 levels to watch will be at about 2,715 (red) and 2,725 (teal) which are its 2 prior downtrends which it closed below this week. However, the Russell 2000 closed at 2,721.37 so it could potentially open above both of these levels on Monday, in which case both the 2,725 and 2,715 levels would be support. From there on a rally attempt, its new primary downtrend (white) would be resistance at about 2,745. If it breaks through it, the next resistances will be at 2,764-2,765 (green), 2,782-2,783 (blue), and finally 2,805 (yellow).
If the Russell 2000 opens lower on Monday below those first 2 levels at 2,725 and 2,715 then they will act as resistance as well as every other level mentioned above. On a continuation of the pullback, the next weekly support will be at 2,665-2,670 (green). If this doesn't hold, the last weekly support to watch will be from the bottom of its primary downtrend (white) at 2,595-2,600 which is about 4.5% away.