Stocks finished modestly higher this week with the Nasdaq gaining 0.60% while the S&P closed the week higher by 1.10% and both indexes reached new all time highs. The Russell 2000 on the other hand finished lower again, falling 0.90% for the week, as yields continued to rise and put pressure on small caps.
Next week will be busy as earnings season kicks off with the big banks beginning to report. Citigroup (C), Goldman Sachs (GS), JPMorgan Chase (JPM), and Wells Fargo (WFC) will all be reporting Tuesday morning followed by Bank of America (BAC) and Morgan Stanley (MS) on Wednesday morning. Along with earnings, we will get the next round of inflation data with CPI on Wednesday morning followed PPI on Thursday morning. There are also Fed speakers scheduled to speak throughout the week with the most notable being Fed Chair Kevin Warsh on Friday, October 16th, at 11:30 PM ET (after U.S. markets have closed) in a fireside chat with IMF Managing Director Kristalina Georgieva in Bangkok, Thailand.
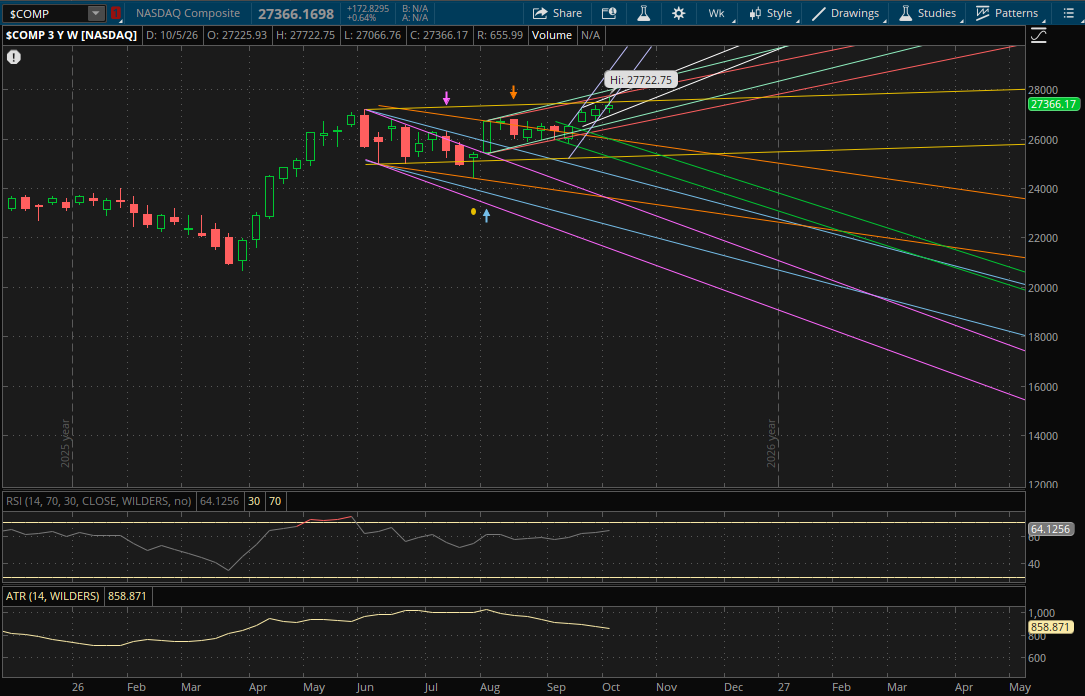
Looking at the technical setup for next week, this week the Nasdaq opened below its previous primary uptrend that was started last week which was expected. It did break through it, but failed to close above it. However, it did make another higher high so it still starts a new primary uptrend (white) for next week. The first resistance level to watch next week will be at about 27,525 from its prior uptrend (yellow). This first resistance is about 0.60% from this week's close of 27,366, so it could potential gap over it in which case the 27,525 area would become support. After that, the next resistance will be at 27,875-27,900 from its next uptrend (red) with more just above that at about 27,950 from its new primary uptrend (white). If it can break through its primary uptrend, the last weekly resistance potentially in play would be at its next uptrend (green) around 28,100.
On a pullback next week, the first support will be at about 27,150 from the bottom of its new primary uptrend (white). If it breaks down through this level then the bottom of its next uptrend (green) will be support at 26,775-26,800. If that doesn't hold, the last weekly support potentially in play would be from the bottom of its next uptrend (red) at 26,525-26,550.
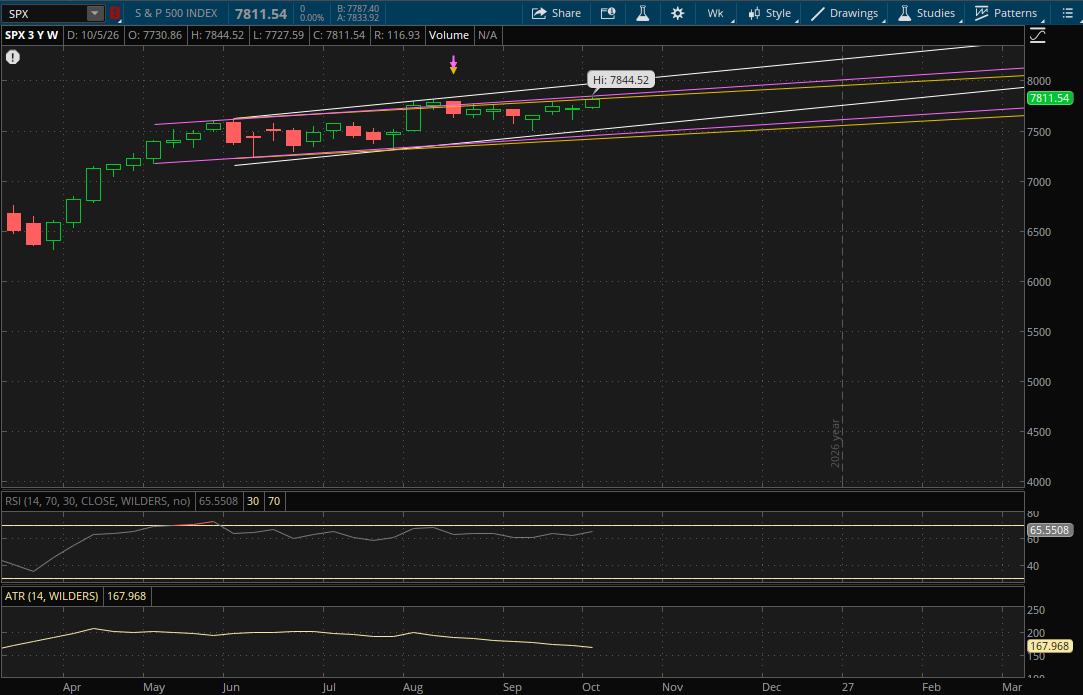
The S&P continues to trade within its big primary weekly uptrend so it doesn't start any new weekly trends for next week. It also hasn't invalidated any of its previous trends, so the first resistance will continue to be at its prior uptrend (yellow) around 7,827-7,828 next week. The S&P closed at 7,811.54 this week, so there is potential for a gap above this resistance next week. If it does gap above the 7,827-7,828 level on Monday then this yellow trend would become support. After that, its next uptrend (purple) would be resistance at 7,863-7,865. This level is also only about 0.70% away so there's potential for a gap above it as well. It would also become support if the S&P opens above this 7,865 level on Monday. If it does break/gap above those first 2 trends, the last weekly resistance to watch would be at its primary uptrend (white) at 7,990-8,000.
If we do get a sharp sell-off next week, the first support would be from the bottom of its primary uptrend (white) at 7,530-7,535. That is about 3.5% away so it would probably be the only support to be tested in the event of a sell-off. However, there would be more below it at about 7,470 (purple) and 7,435 (yellow).
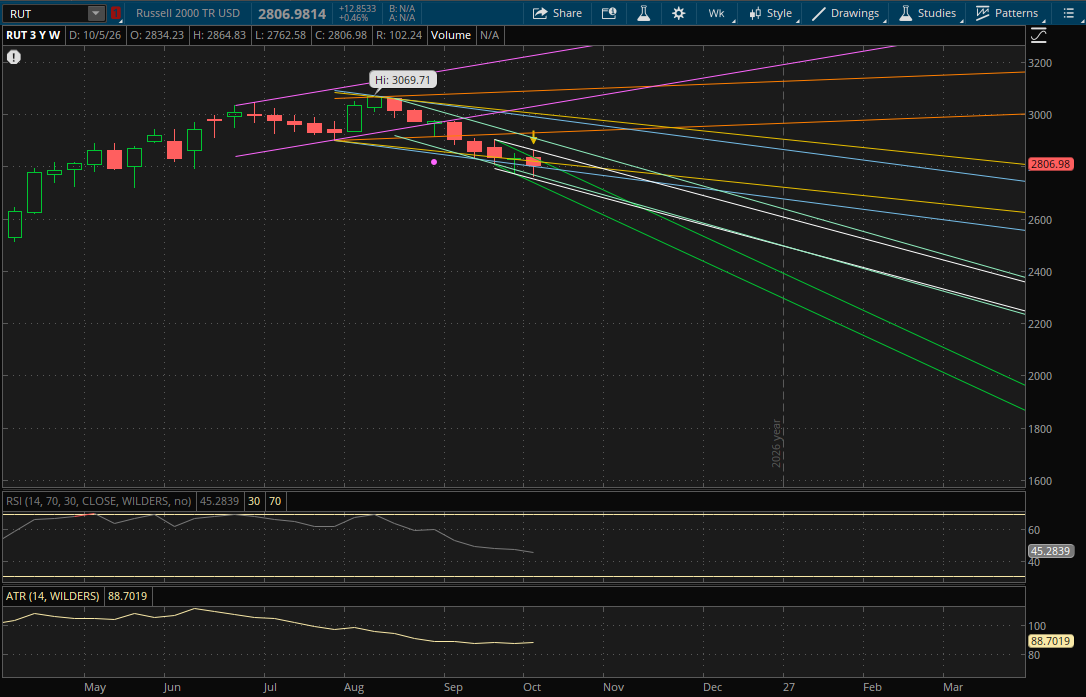
The Russell 2000 broke above last week's primary downtrend but failed to close above it which gives it a failed breakout and starts a new primary downtrend. This wasn't a strong failed breakdown, so it's not a short signal, but it does add another level of resistance now. The first key level to watch next week will be right around 2,800 (green) which is the previous primary downtrend that it failed to close above this week. The Russell finished at almost 2,807 yesterday, so as long as it doesn't gap down on Monday this 2,800 and prior downtrend will act as support on a pullback. After that, its next downtrend (yellow) will be resistance at 2,814-2,815. If it were to gap above it, this yellow downtrend would become support as well. The next resistance to watch would then be its new primary downtrend (white) at 2,843-2,845. If it breaks through it, the last weekly resistance in play for next week would be from its next downtrend (light green) at 2,885-2,890.
If we get another pullback in small caps, the 2,800 level from its prior downtrend (green) would be the first support to watch. If it gaps below it on Monday, then this 2,800 level becomes resistance. The next support to watch would then be at about 2,792 (blue). If this doesn't hold, the next weekly support is further away at 2,745-2,747 from the bottom of its next downtrend (light green) and then the bottom of its primary downtrend (white) would be support just below that at 2,733-2,735 which would likely be the last weekly support in play. If it were to break through that primary downtrend, the last weekly support would be from the bottom of its last downtrend (green) at 2,700-2,705.