Tech was the leader this week as the Nasdaq was the only index to finish positive with a big rally back into the end of the week after the Fed raised interest rates for the first time since 2023. The Nasdaq posted a weekly gain of 0.70% while the S&P finished down slightly - essentially flat on the week. The Russell 2000 was the big laggard, closing down 1.5% on the week as the rate sensitive index continued to underperform in the face of rate hikes.
For next week, there isn't much economic data, but there will be a lot of Fed speak early in the week on Monday and Tuesday. Comments from Fed officials will likely move yields as markets assess whether this week's hike was a one-and-done or the start of a new, sustained hiking cycle. On Thursday President Xi is expected to meet with President Trump as they talk tariffs and trade, Iran, and AI in light of the recent concerns about AI companies moving too fast.
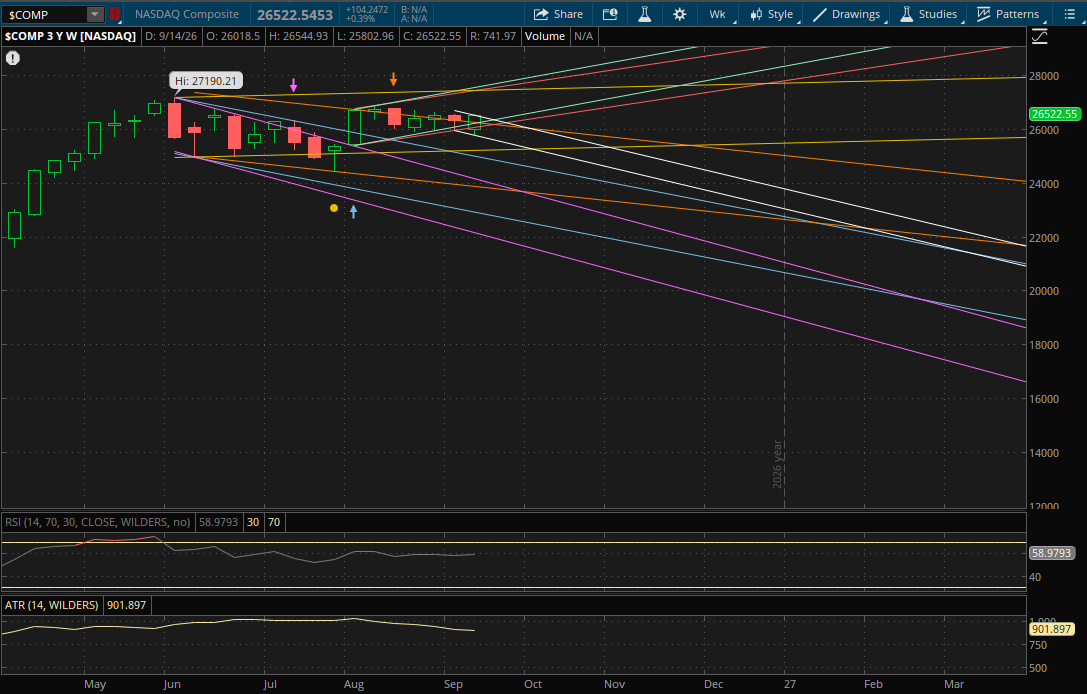
Looking at the technical setup for next week, the Nasdaq had a failed weekly breakdown this week and a strong finish near the highs of week. It did start a new primary downtrend as it made a lower low, but it will likely open above this new primary downtrend (white) on Monday. The first big weekly support area to watch will be at about 26,360-26,385 from both its prior uptrend (green) and its new primary downtrend (white) where the 2 trends intersect. The Nasdaq closed at 26,522 which is well above those 2 trends, so barring a large gap down on Monday, they will act as support on a pullback. From there, the next weekly resistance will be around 27,475 from its prior sideways range (yellow) which is about 3.5% away and may not actually be tested. Instead it will start a new trend, but we'll have to see how it closes to determine the direction of that new trend.
If the Nasdaq were to gap down below the first 2 supports at 26,360-26,385 (green and white), then this area would end up becoming resistance. From there, the next big weekly support on a continued pullback would be at 26,175-26,200 from its prior uptrend (red) and prior downtrend (orange) where those 2 trends intersect. If none of those hold, the last weekly support that likely comes into play would be from its new primary downtrend (white) at about 25,625.
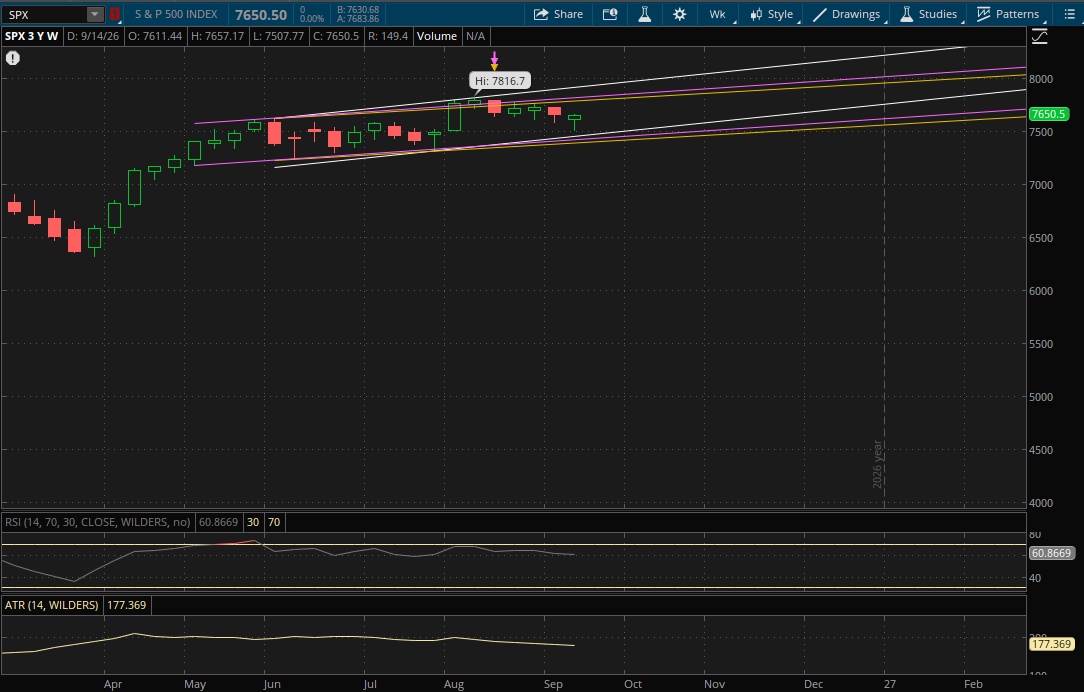
The S&P nearly reached the bottom of its primary uptrend (white) this week, hitting a low of 7,507.77. Over the past month I have been talking about this pullback towards the bottom end of this range after the big breakdown in mid-August. I was looking for a move into the 7,400's, but because it was so choppy and took longer than expected, that support continued to rise and made the risk/reward for a short setup less favorable.
The S&P did not break through this primary uptrend this week, so it doesn't start any new weekly ranges. First we'll look at resistances for next week. Its prior uptrend (yellow) will continue to act as the first resistance around 7,795. If it breaks through it, the next weekly uptrend (purple) will be resistance at about 7,825 which would be new all time highs for it. After that, the last weekly resistance will be from its primary uptrend (white) around 7,935 if we were to get a big rally. However this last resistance is nearly 4% away so it's unlikely that we actually get up there next week.
If there's another pullback, its primary uptrend (white) will continue to be the first support to watch at 7,470-7,475. If it doesn't hold, the next support will be at 7,430 (purple), and finally the last weekly support will be at 7,400-7,405 (yellow).
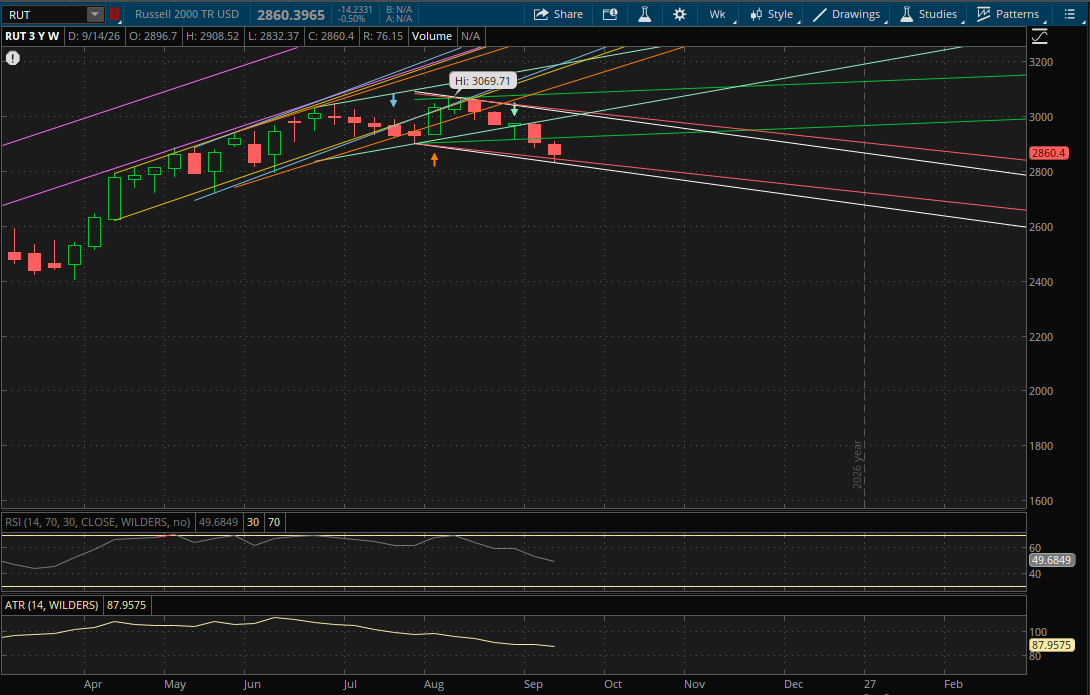
The Russell 2000 broke below its last primary downtrend, but closed back over it for a failed breakdown. It also made a lower low so it does start a new downtrend. While it wasn't a strong finish on this failed breakdown, it does now have an added level of support from its new primary downtrend (white).
If we get a rally back in small caps, the first resistance to watch will be from its prior uptrend (green) at about 2,925. After that, its next resistances are farther away at about 3,005 (teal), 3,010 (white - primary downtrend), and 3,020 (red).
On a continuation of the pullback, the first support to watch will be at about 2,838 which will be a retest of this week's failed breakdown (red). If that doesn't hold, the last weekly support to watch will be from its new primary downtrend (white) at 2,821-2,822.